| No. of Bulls (birth year >= 1999) by country |
| Sent data format 300 - Trait : mil |
| Country | Year of birth | Sum | ||||||||||||||||||
|---|---|---|---|---|---|---|---|---|---|---|---|---|---|---|---|---|---|---|---|---|
| 1999 | 2000 | 2001 | 2002 | 2003 | 2004 | 2005 | 2006 | 2007 | 2008 | 2009 | 2010 | 2011 | 2012 | 2013 | 2014 | 2015 | 2016 | |||
| AUT | AUSTRIA | 1 | 1 | 4 | 3 | 1 | 2 | 1 | 1 | 3 | 4 | 6 | 2 | 1 | 3 | 8 | 2 | 43 | ||
| CZE | CZECH REPUBLIC | 1 | 1 | 1 | 3 | |||||||||||||||
| DEU | GERMANY | 6 | 8 | 9 | 14 | 8 | 8 | 8 | 12 | 6 | 6 | 8 | 9 | 4 | 9 | 8 | 7 | 8 | 1 | 139 |
| DNK | DENMARK | 1 | 1 | |||||||||||||||||
| ITA | ITALY | 1 | 1 | 2 | ||||||||||||||||
| SVK | SLOVAKIA | 1 | 1 | |||||||||||||||||
| SVN | SLOVENIA | 21 | 21 | 18 | 17 | 21 | 23 | 16 | 23 | 19 | 18 | 19 | 21 | 19 | 19 | 18 | 14 | 13 | 6 | 326 |
| Sum | 28 | 29 | 28 | 36 | 33 | 34 | 27 | 36 | 27 | 27 | 31 | 36 | 26 | 28 | 27 | 24 | 29 | 9 | 515 | |
| Interbul test evaluation 203r |
| Population : SVN - SIM |
| No. of Bulls (birth year >= 1999) by origin |
| Sent data format 300 - Trait : mil |
| Origin | Year of birth | Sum | |||||||||||||||||
|---|---|---|---|---|---|---|---|---|---|---|---|---|---|---|---|---|---|---|---|
| 1999 | 2000 | 2001 | 2002 | 2003 | 2004 | 2005 | 2006 | 2007 | 2008 | 2009 | 2010 | 2011 | 2012 | 2013 | 2014 | 2015 | 2016 | ||
| SVN | 21 | 21 | 18 | 17 | 21 | 23 | 16 | 23 | 19 | 18 | 19 | 21 | 19 | 19 | 18 | 14 | 13 | 6 | 326 |
| Foreign | 7 | 8 | 10 | 19 | 12 | 11 | 11 | 13 | 8 | 9 | 12 | 15 | 7 | 9 | 9 | 10 | 16 | 3 | 189 |
| Sum | 28 | 29 | 28 | 36 | 33 | 34 | 27 | 36 | 27 | 27 | 31 | 36 | 26 | 28 | 27 | 24 | 29 | 9 | 515 |
| Interbul test evaluation 203r |
| Population : SVN - SIM |
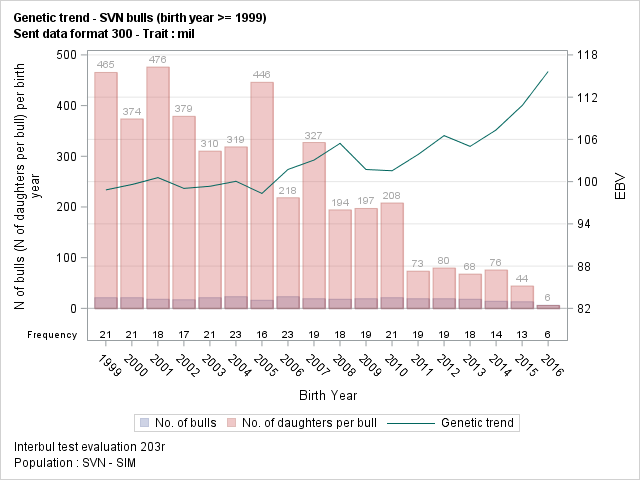
| Genetic trend - SVN bulls (birth year >= 1999) |
| Sent data format 300 - Trait : mil |
| Year | EBV | N Daughter | |||||||
|---|---|---|---|---|---|---|---|---|---|
| n Bull | Mean | Std | Min | Max | Sum | Mean | Min | Max | |
| 1999 | 21 | 98.8 | 4.72 | 90.5 | 107.2 | 9773 | 465 | 127 | 919 |
| 2000 | 21 | 99.6 | 4.84 | 92.6 | 112.2 | 7848 | 374 | 1 | 1117 |
| 2001 | 18 | 100.6 | 7.27 | 90.1 | 117.4 | 8570 | 476 | 73 | 1866 |
| 2002 | 17 | 99.0 | 4.27 | 90.9 | 107.1 | 6441 | 379 | 1 | 1361 |
| 2003 | 21 | 99.3 | 7.30 | 87.2 | 112.8 | 6515 | 310 | 29 | 1070 |
| 2004 | 23 | 100.0 | 5.06 | 91.0 | 115.6 | 7327 | 319 | 1 | 1188 |
| 2005 | 16 | 98.3 | 3.00 | 93.6 | 103.7 | 7135 | 446 | 92 | 1444 |
| 2006 | 23 | 101.7 | 4.32 | 94.5 | 111.6 | 5019 | 218 | 1 | 1484 |
| 2007 | 19 | 103.1 | 3.80 | 96.6 | 110.4 | 6216 | 327 | 77 | 728 |
| 2008 | 18 | 105.4 | 4.89 | 97.5 | 116.9 | 3497 | 194 | 1 | 993 |
| 2009 | 19 | 101.7 | 3.18 | 94.4 | 107.6 | 3744 | 197 | 1 | 666 |
| 2010 | 21 | 101.5 | 6.72 | 92.8 | 119.1 | 4366 | 208 | 3 | 611 |
| 2011 | 19 | 103.9 | 4.57 | 96.1 | 112.9 | 1395 | 73 | 5 | 150 |
| 2012 | 19 | 106.5 | 4.63 | 100.6 | 114.5 | 1513 | 80 | 42 | 176 |
| 2013 | 18 | 105.0 | 5.93 | 93.2 | 112.6 | 1218 | 68 | 30 | 113 |
| 2014 | 14 | 107.3 | 10.62 | 85.1 | 124.5 | 1060 | 76 | 26 | 182 |
| 2015 | 13 | 110.8 | 11.33 | 91.4 | 137.1 | 574 | 44 | 6 | 136 |
| 2016 | 6 | 115.6 | 8.45 | 105.5 | 127.0 | 34 | 6 | 1 | 13 |
| Sum | 326 | 102.5 | 6.80 | 85.1 | 137.1 | 82245 | 252 | 1 | 1866 |
| Interbul test evaluation 203r |
| Population : SVN - SIM |
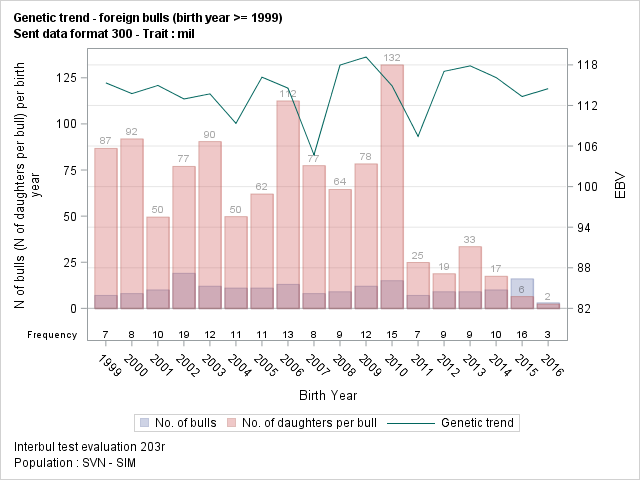
| Genetic trend - foreign bulls (birth year >= 1999) |
| Sent data format 300 - Trait : mil |
| Year | EBV | N Daughter | |||||||
|---|---|---|---|---|---|---|---|---|---|
| n Bull | Mean | Std | Min | Max | Sum | Mean | Min | Max | |
| 1999 | 7 | 115.3 | 10.23 | 100.0 | 128.9 | 607 | 87 | 9 | 201 |
| 2000 | 8 | 113.8 | 4.51 | 105.8 | 118.3 | 735 | 92 | 1 | 458 |
| 2001 | 10 | 115.0 | 3.23 | 110.1 | 119.4 | 495 | 50 | 2 | 118 |
| 2002 | 19 | 113.0 | 8.52 | 89.5 | 126.1 | 1462 | 77 | 1 | 409 |
| 2003 | 12 | 113.7 | 6.51 | 99.6 | 125.5 | 1085 | 90 | 3 | 234 |
| 2004 | 11 | 109.4 | 9.43 | 85.1 | 119.3 | 547 | 50 | 5 | 98 |
| 2005 | 11 | 116.2 | 5.69 | 108.4 | 125.1 | 682 | 62 | 20 | 127 |
| 2006 | 13 | 114.6 | 12.32 | 80.3 | 126.4 | 1462 | 112 | 5 | 362 |
| 2007 | 8 | 104.7 | 17.82 | 75.3 | 124.4 | 619 | 77 | 1 | 299 |
| 2008 | 9 | 118.0 | 9.25 | 105.4 | 129.0 | 580 | 64 | 14 | 149 |
| 2009 | 12 | 119.2 | 10.49 | 99.3 | 140.2 | 940 | 78 | 1 | 252 |
| 2010 | 15 | 114.9 | 8.32 | 102.1 | 130.3 | 1980 | 132 | 8 | 685 |
| 2011 | 7 | 107.4 | 14.77 | 76.6 | 125.4 | 174 | 25 | 2 | 62 |
| 2012 | 9 | 117.0 | 8.14 | 99.9 | 124.9 | 169 | 19 | 1 | 62 |
| 2013 | 9 | 117.9 | 9.23 | 102.3 | 126.6 | 301 | 33 | 5 | 70 |
| 2014 | 10 | 116.1 | 10.83 | 102.0 | 137.4 | 174 | 17 | 1 | 32 |
| 2015 | 16 | 113.3 | 8.22 | 101.4 | 124.5 | 102 | 6 | 1 | 24 |
| 2016 | 3 | 114.5 | 5.57 | 109.3 | 120.4 | 7 | 2 | 1 | 4 |
| Sum | 189 | 114.2 | 9.64 | 75.3 | 140.2 | 12121 | 64 | 1 | 685 |
| Interbul test evaluation 203r |
| Population : SVN - SIM |
| No. of Bulls (meet validation's criteria) by country |
| Sent data format 300 - Trait : mil |
| Validation's criteria : |
| - N daughter min. : 20 |
| - N herd min. : 10 |
| - Year birth min. : 1999 |
| Country | Year of birth | Sum | |||||||||||||||||
|---|---|---|---|---|---|---|---|---|---|---|---|---|---|---|---|---|---|---|---|
| 1999 | 2000 | 2001 | 2002 | 2003 | 2004 | 2005 | 2006 | 2007 | 2008 | 2009 | 2010 | 2011 | 2012 | 2013 | 2014 | 2015 | |||
| AUT | AUSTRIA | 1 | 1 | 4 | 3 | 1 | 2 | 1 | 2 | 3 | 6 | 1 | 1 | 1 | 1 | 28 | |||
| CZE | CZECH REPUBLIC | 1 | 1 | 2 | |||||||||||||||
| DEU | GERMANY | 5 | 6 | 6 | 11 | 6 | 7 | 8 | 10 | 4 | 6 | 6 | 8 | 3 | 3 | 5 | 5 | 99 | |
| ITA | ITALY | 1 | 1 | 2 | |||||||||||||||
| SVK | SLOVAKIA | 1 | 1 | ||||||||||||||||
| SVN | SLOVENIA | 21 | 20 | 18 | 16 | 20 | 21 | 16 | 22 | 19 | 16 | 17 | 20 | 18 | 19 | 18 | 14 | 10 | 305 |
| Sum | 27 | 26 | 25 | 32 | 30 | 31 | 27 | 33 | 23 | 24 | 26 | 34 | 22 | 22 | 24 | 20 | 11 | 437 | |
| Interbul test evaluation 203r |
| Population : SVN - SIM |
| No. of Bulls (meet validation's criteria) by origin |
| Sent data format 300 - Trait : mil |
| Origin | Year of birth | Sum | ||||||||||||||||
|---|---|---|---|---|---|---|---|---|---|---|---|---|---|---|---|---|---|---|
| 1999 | 2000 | 2001 | 2002 | 2003 | 2004 | 2005 | 2006 | 2007 | 2008 | 2009 | 2010 | 2011 | 2012 | 2013 | 2014 | 2015 | ||
| SVN | 21 | 20 | 18 | 16 | 20 | 21 | 16 | 22 | 19 | 16 | 17 | 20 | 18 | 19 | 18 | 14 | 10 | 305 |
| Foreign | 6 | 6 | 7 | 16 | 10 | 10 | 11 | 11 | 4 | 8 | 9 | 14 | 4 | 3 | 6 | 6 | 1 | 132 |
| Sum | 27 | 26 | 25 | 32 | 30 | 31 | 27 | 33 | 23 | 24 | 26 | 34 | 22 | 22 | 24 | 20 | 11 | 437 |
| Interbul test evaluation 203r |
| Population : SVN - SIM |
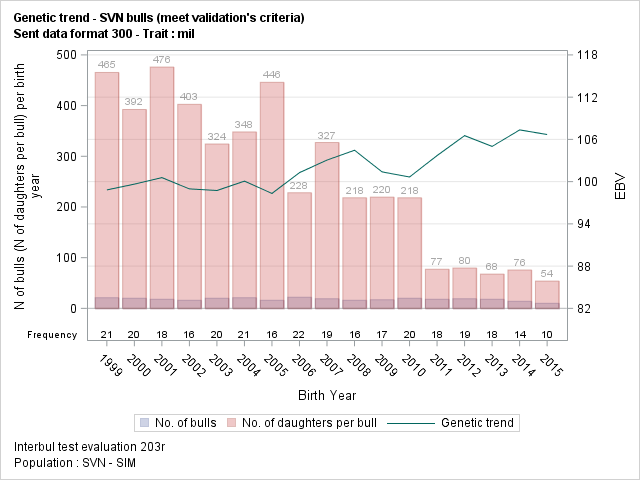
| Genetic trend - SVN bulls (meet validation's criteria) |
| Sent data format 300 - Trait : mil |
| Year | EBV | N Daughter | |||||||
|---|---|---|---|---|---|---|---|---|---|
| n Bull | Mean | Std | Min | Max | Sum | Mean | Min | Max | |
| 1999 | 21 | 98.8 | 4.72 | 90.5 | 107.2 | 9773 | 465 | 127 | 919 |
| 2000 | 20 | 99.6 | 4.96 | 92.6 | 112.2 | 7847 | 392 | 48 | 1117 |
| 2001 | 18 | 100.6 | 7.27 | 90.1 | 117.4 | 8570 | 476 | 73 | 1866 |
| 2002 | 16 | 99.0 | 4.39 | 90.9 | 107.1 | 6440 | 403 | 125 | 1361 |
| 2003 | 20 | 98.7 | 6.92 | 87.2 | 112.8 | 6486 | 324 | 103 | 1070 |
| 2004 | 21 | 100.1 | 4.51 | 92.0 | 115.6 | 7310 | 348 | 107 | 1188 |
| 2005 | 16 | 98.3 | 3.00 | 93.6 | 103.7 | 7135 | 446 | 92 | 1444 |
| 2006 | 22 | 101.3 | 3.83 | 94.5 | 108.3 | 5018 | 228 | 74 | 1484 |
| 2007 | 19 | 103.1 | 3.80 | 96.6 | 110.4 | 6216 | 327 | 77 | 728 |
| 2008 | 16 | 104.5 | 4.01 | 97.5 | 111.4 | 3491 | 218 | 32 | 993 |
| 2009 | 17 | 101.4 | 3.01 | 94.4 | 106.4 | 3732 | 220 | 74 | 666 |
| 2010 | 20 | 100.7 | 5.53 | 92.8 | 112.7 | 4363 | 218 | 35 | 611 |
| 2011 | 18 | 103.7 | 4.65 | 96.1 | 112.9 | 1390 | 77 | 32 | 150 |
| 2012 | 19 | 106.5 | 4.63 | 100.6 | 114.5 | 1513 | 80 | 42 | 176 |
| 2013 | 18 | 105.0 | 5.93 | 93.2 | 112.6 | 1218 | 68 | 30 | 113 |
| 2014 | 14 | 107.3 | 10.62 | 85.1 | 124.5 | 1060 | 76 | 26 | 182 |
| 2015 | 10 | 106.7 | 7.85 | 91.4 | 114.5 | 539 | 54 | 21 | 136 |
| Sum | 305 | 101.8 | 5.98 | 85.1 | 124.5 | 82101 | 269 | 21 | 1866 |
| Interbul test evaluation 203r |
| Population : SVN - SIM |
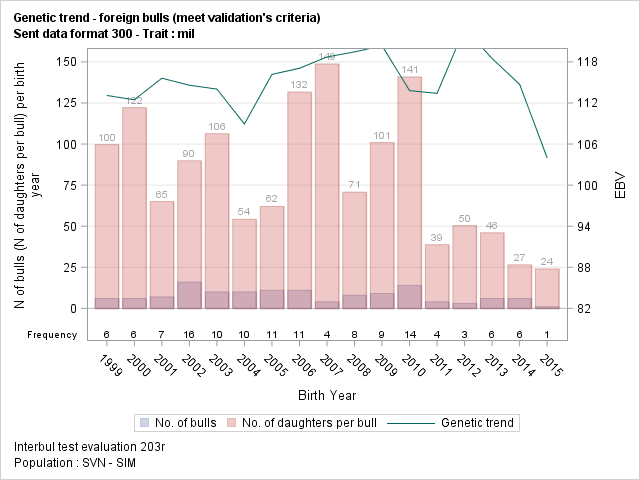
| Genetic trend - foreign bulls (meet validation's criteria) |
| Sent data format 300 - Trait : mil |
| Year | EBV | N Daughter | |||||||
|---|---|---|---|---|---|---|---|---|---|
| n Bull | Mean | Std | Min | Max | Sum | Mean | Min | Max | |
| 1999 | 6 | 113.1 | 9.10 | 100.0 | 123.0 | 598 | 100 | 34 | 201 |
| 2000 | 6 | 112.5 | 4.51 | 105.8 | 118.0 | 733 | 122 | 29 | 458 |
| 2001 | 7 | 115.6 | 3.33 | 110.3 | 119.4 | 455 | 65 | 21 | 118 |
| 2002 | 16 | 114.6 | 6.51 | 102.8 | 126.1 | 1437 | 90 | 33 | 409 |
| 2003 | 10 | 114.0 | 6.87 | 99.6 | 125.5 | 1063 | 106 | 28 | 234 |
| 2004 | 10 | 108.9 | 9.83 | 85.1 | 119.3 | 542 | 54 | 23 | 98 |
| 2005 | 11 | 116.2 | 5.69 | 108.4 | 125.1 | 682 | 62 | 20 | 127 |
| 2006 | 11 | 117.1 | 7.28 | 106.5 | 126.4 | 1448 | 132 | 21 | 362 |
| 2007 | 4 | 118.7 | 7.22 | 108.1 | 124.4 | 595 | 149 | 31 | 299 |
| 2008 | 8 | 119.5 | 8.65 | 105.4 | 129.0 | 566 | 71 | 24 | 149 |
| 2009 | 9 | 120.4 | 9.42 | 111.2 | 140.2 | 908 | 101 | 24 | 252 |
| 2010 | 14 | 113.8 | 7.41 | 102.1 | 128.8 | 1972 | 141 | 25 | 685 |
| 2011 | 4 | 113.4 | 7.98 | 109.4 | 125.4 | 155 | 39 | 26 | 62 |
| 2012 | 3 | 122.9 | 2.65 | 119.9 | 124.9 | 151 | 50 | 33 | 62 |
| 2013 | 6 | 118.5 | 8.36 | 106.4 | 126.2 | 276 | 46 | 22 | 70 |
| 2014 | 6 | 114.7 | 12.73 | 102.0 | 137.4 | 159 | 27 | 21 | 32 |
| 2015 | 1 | 104.0 | 104.0 | 104.0 | 24 | 24 | 24 | 24 | |
| Sum | 132 | 115.3 | 7.92 | 85.1 | 140.2 | 11764 | 89 | 20 | 685 |
| Interbul test evaluation 203r |
| Population : SVN - SIM |