| No. of Bulls (birth year >= 1999) by country |
| Sent data format 300 - Trait : mil |
| Country | Year of birth | Sum | ||||||||||||||||||
|---|---|---|---|---|---|---|---|---|---|---|---|---|---|---|---|---|---|---|---|---|
| 1999 | 2000 | 2001 | 2002 | 2003 | 2004 | 2005 | 2006 | 2007 | 2008 | 2009 | 2010 | 2011 | 2012 | 2013 | 2014 | 2015 | 2016 | |||
| AUT | AUSTRIA | 1 | 1 | 1 | 1 | 2 | 6 | |||||||||||||
| CHE | SWITZERLAND | 1 | 1 | 1 | 7 | 2 | 3 | 6 | 2 | 2 | 1 | 2 | 3 | 2 | 33 | |||||
| DEU | GERMANY | 2 | 3 | 4 | 4 | 6 | 1 | 6 | 3 | 2 | 3 | 2 | 2 | 2 | 4 | 2 | 4 | 1 | 51 | |
| ITA | ITALY | 5 | 1 | 4 | 1 | 1 | 3 | 2 | 2 | 1 | 1 | 2 | 23 | |||||||
| SVN | SLOVENIA | 12 | 12 | 10 | 11 | 14 | 10 | 15 | 8 | 10 | 10 | 13 | 13 | 8 | 5 | 6 | 7 | 6 | 1 | 171 |
| USA | USA | 1 | 1 | 1 | 1 | 1 | 1 | 1 | 2 | 1 | 1 | 2 | 13 | |||||||
| Sum | 20 | 18 | 21 | 19 | 28 | 15 | 29 | 14 | 20 | 17 | 17 | 18 | 10 | 13 | 12 | 16 | 9 | 1 | 297 | |
| Interbul test evaluation 203r |
| Population : SVN - BSW |
| No. of Bulls (birth year >= 1999) by origin |
| Sent data format 300 - Trait : mil |
| Origin | Year of birth | Sum | |||||||||||||||||
|---|---|---|---|---|---|---|---|---|---|---|---|---|---|---|---|---|---|---|---|
| 1999 | 2000 | 2001 | 2002 | 2003 | 2004 | 2005 | 2006 | 2007 | 2008 | 2009 | 2010 | 2011 | 2012 | 2013 | 2014 | 2015 | 2016 | ||
| SVN | 12 | 12 | 10 | 11 | 14 | 10 | 15 | 8 | 10 | 10 | 13 | 13 | 8 | 5 | 6 | 7 | 6 | 1 | 171 |
| Foreign | 8 | 6 | 11 | 8 | 14 | 5 | 14 | 6 | 10 | 7 | 4 | 5 | 2 | 8 | 6 | 9 | 3 | 126 | |
| Sum | 20 | 18 | 21 | 19 | 28 | 15 | 29 | 14 | 20 | 17 | 17 | 18 | 10 | 13 | 12 | 16 | 9 | 1 | 297 |
| Interbul test evaluation 203r |
| Population : SVN - BSW |
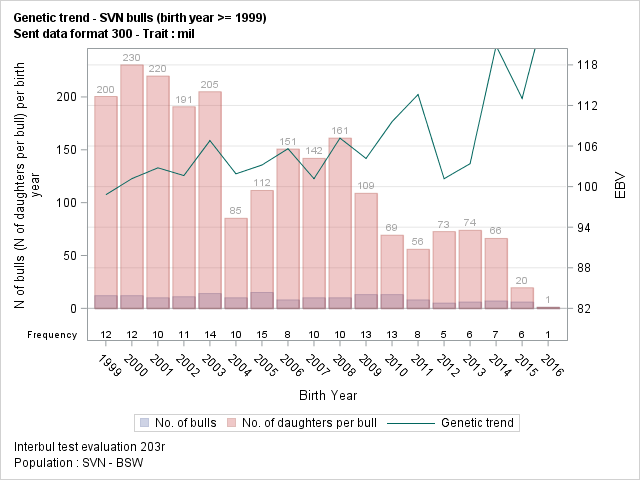
| Genetic trend - SVN bulls (birth year >= 1999) |
| Sent data format 300 - Trait : mil |
| Year | EBV | N Daughter | |||||||
|---|---|---|---|---|---|---|---|---|---|
| n Bull | Mean | Std | Min | Max | Sum | Mean | Min | Max | |
| 1999 | 12 | 98.8 | 8.42 | 74.1 | 106.3 | 2405 | 200 | 83 | 449 |
| 2000 | 12 | 101.2 | 5.71 | 87.5 | 108.0 | 2764 | 230 | 8 | 742 |
| 2001 | 10 | 102.8 | 4.49 | 93.2 | 111.0 | 2198 | 220 | 83 | 676 |
| 2002 | 11 | 101.6 | 3.65 | 94.0 | 106.5 | 2098 | 191 | 51 | 734 |
| 2003 | 14 | 106.8 | 7.64 | 96.1 | 123.4 | 2869 | 205 | 1 | 853 |
| 2004 | 10 | 101.9 | 8.21 | 89.8 | 114.6 | 852 | 85 | 21 | 165 |
| 2005 | 15 | 103.2 | 7.64 | 82.8 | 111.3 | 1673 | 112 | 18 | 405 |
| 2006 | 8 | 105.6 | 6.16 | 94.4 | 111.9 | 1206 | 151 | 65 | 332 |
| 2007 | 10 | 101.2 | 9.58 | 75.0 | 108.8 | 1419 | 142 | 59 | 372 |
| 2008 | 10 | 107.2 | 3.74 | 100.2 | 112.1 | 1611 | 161 | 26 | 535 |
| 2009 | 13 | 104.2 | 6.63 | 88.7 | 111.7 | 1415 | 109 | 61 | 219 |
| 2010 | 13 | 109.6 | 7.66 | 97.1 | 121.3 | 900 | 69 | 1 | 192 |
| 2011 | 8 | 113.6 | 3.97 | 106.8 | 119.5 | 447 | 56 | 12 | 95 |
| 2012 | 5 | 101.2 | 11.22 | 82.0 | 110.3 | 363 | 73 | 19 | 110 |
| 2013 | 6 | 103.4 | 6.50 | 94.8 | 112.3 | 443 | 74 | 21 | 160 |
| 2014 | 7 | 120.8 | 6.26 | 110.2 | 127.3 | 463 | 66 | 9 | 273 |
| 2015 | 6 | 113.0 | 5.88 | 103.1 | 118.9 | 117 | 20 | 1 | 56 |
| 2016 | 1 | 127.9 | 127.9 | 127.9 | 1 | 1 | 1 | 1 | |
| Sum | 171 | 105.3 | 8.45 | 74.1 | 127.9 | 23244 | 136 | 1 | 853 |
| Interbul test evaluation 203r |
| Population : SVN - BSW |
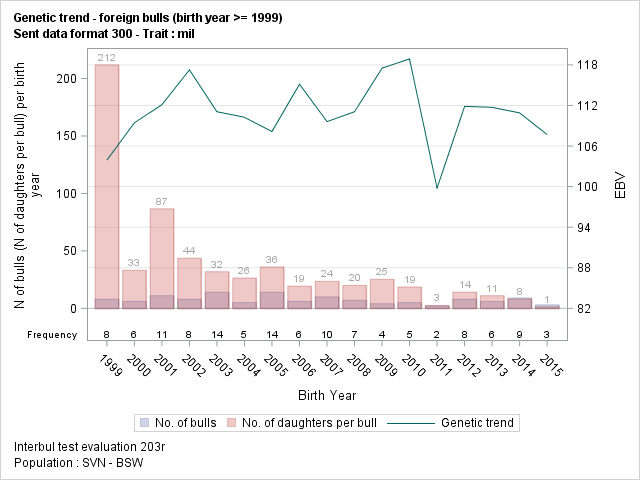
| Genetic trend - foreign bulls (birth year >= 1999) |
| Sent data format 300 - Trait : mil |
| Year | EBV | N Daughter | |||||||
|---|---|---|---|---|---|---|---|---|---|
| n Bull | Mean | Std | Min | Max | Sum | Mean | Min | Max | |
| 1999 | 8 | 103.9 | 8.08 | 92.3 | 120.2 | 1695 | 212 | 5 | 1311 |
| 2000 | 6 | 109.4 | 4.23 | 101.9 | 114.3 | 199 | 33 | 3 | 74 |
| 2001 | 11 | 112.1 | 5.28 | 105.0 | 121.8 | 953 | 87 | 11 | 600 |
| 2002 | 8 | 117.3 | 11.09 | 104.6 | 133.7 | 349 | 44 | 8 | 122 |
| 2003 | 14 | 111.1 | 8.53 | 98.4 | 128.1 | 446 | 32 | 1 | 78 |
| 2004 | 5 | 110.3 | 9.26 | 99.1 | 124.6 | 132 | 26 | 5 | 58 |
| 2005 | 14 | 108.1 | 6.68 | 93.9 | 119.4 | 505 | 36 | 7 | 196 |
| 2006 | 6 | 115.1 | 3.25 | 111.4 | 120.6 | 116 | 19 | 3 | 39 |
| 2007 | 10 | 109.6 | 8.57 | 97.1 | 122.4 | 235 | 24 | 1 | 43 |
| 2008 | 7 | 111.1 | 6.33 | 104.0 | 123.8 | 140 | 20 | 11 | 31 |
| 2009 | 4 | 117.5 | 5.30 | 110.4 | 122.1 | 101 | 25 | 14 | 29 |
| 2010 | 5 | 118.9 | 8.46 | 105.5 | 127.1 | 93 | 19 | 10 | 47 |
| 2011 | 2 | 99.8 | 14.98 | 89.2 | 110.4 | 5 | 3 | 1 | 4 |
| 2012 | 8 | 111.9 | 6.60 | 100.9 | 117.8 | 113 | 14 | 2 | 23 |
| 2013 | 6 | 111.7 | 15.13 | 90.4 | 131.8 | 66 | 11 | 7 | 16 |
| 2014 | 9 | 110.9 | 10.32 | 94.2 | 125.8 | 73 | 8 | 1 | 22 |
| 2015 | 3 | 107.7 | 5.43 | 101.4 | 110.8 | 4 | 1 | 1 | 2 |
| Sum | 126 | 111.1 | 8.59 | 89.2 | 133.7 | 5225 | 41 | 1 | 1311 |
| Interbul test evaluation 203r |
| Population : SVN - BSW |
| No. of Bulls (meet validation's criteria) by country |
| Sent data format 300 - Trait : mil |
| Validation's criteria : |
| - N daughter min. : 20 |
| - N herd min. : 10 |
| - Year birth min. : 1999 |
| Country | Year of birth | Sum | |||||||||||||||||
|---|---|---|---|---|---|---|---|---|---|---|---|---|---|---|---|---|---|---|---|
| 1999 | 2000 | 2001 | 2002 | 2003 | 2004 | 2005 | 2006 | 2007 | 2008 | 2009 | 2010 | 2011 | 2012 | 2013 | 2014 | 2015 | |||
| AUT | AUSTRIA | 1 | 1 | 1 | 1 | 2 | 6 | ||||||||||||
| CHE | SWITZERLAND | 1 | 1 | 1 | 3 | 1 | 3 | 2 | 1 | 1 | 2 | 1 | 17 | ||||||
| DEU | GERMANY | 1 | 2 | 2 | 4 | 5 | 1 | 2 | 1 | 1 | 2 | 1 | 22 | ||||||
| ITA | ITALY | 5 | 1 | 4 | 1 | 2 | 2 | 15 | |||||||||||
| SVN | SLOVENIA | 12 | 11 | 10 | 11 | 13 | 10 | 14 | 8 | 10 | 10 | 13 | 11 | 7 | 4 | 6 | 4 | 2 | 156 |
| USA | USA | 1 | 1 | 1 | 1 | 1 | 1 | 6 | |||||||||||
| Sum | 19 | 16 | 19 | 18 | 22 | 13 | 19 | 11 | 16 | 14 | 16 | 12 | 7 | 7 | 6 | 5 | 2 | 222 | |
| Interbul test evaluation 203r |
| Population : SVN - BSW |
| No. of Bulls (meet validation's criteria) by origin |
| Sent data format 300 - Trait : mil |
| Origin | Year of birth | Sum | ||||||||||||||||
|---|---|---|---|---|---|---|---|---|---|---|---|---|---|---|---|---|---|---|
| 1999 | 2000 | 2001 | 2002 | 2003 | 2004 | 2005 | 2006 | 2007 | 2008 | 2009 | 2010 | 2011 | 2012 | 2013 | 2014 | 2015 | ||
| SVN | 12 | 11 | 10 | 11 | 13 | 10 | 14 | 8 | 10 | 10 | 13 | 11 | 7 | 4 | 6 | 4 | 2 | 156 |
| Foreign | 7 | 5 | 9 | 7 | 9 | 3 | 5 | 3 | 6 | 4 | 3 | 1 | 3 | 1 | 66 | |||
| Sum | 19 | 16 | 19 | 18 | 22 | 13 | 19 | 11 | 16 | 14 | 16 | 12 | 7 | 7 | 6 | 5 | 2 | 222 |
| Interbul test evaluation 203r |
| Population : SVN - BSW |
| Genetic trend - SVN bulls (meet validation's criteria) |
| Sent data format 300 - Trait : mil |
| Year | EBV | N Daughter | |||||||
|---|---|---|---|---|---|---|---|---|---|
| n Bull | Mean | Std | Min | Max | Sum | Mean | Min | Max | |
| 1999 | 12 | 98.8 | 8.42 | 74.1 | 106.3 | 2405 | 200 | 83 | 449 |
| 2000 | 11 | 100.6 | 5.59 | 87.5 | 108.0 | 2756 | 251 | 96 | 742 |
| 2001 | 10 | 102.8 | 4.49 | 93.2 | 111.0 | 2198 | 220 | 83 | 676 |
| 2002 | 11 | 101.6 | 3.65 | 94.0 | 106.5 | 2098 | 191 | 51 | 734 |
| 2003 | 13 | 105.5 | 6.20 | 96.1 | 115.6 | 2868 | 221 | 57 | 853 |
| 2004 | 10 | 101.9 | 8.21 | 89.8 | 114.6 | 852 | 85 | 21 | 165 |
| 2005 | 14 | 102.6 | 7.58 | 82.8 | 110.3 | 1655 | 118 | 24 | 405 |
| 2006 | 8 | 105.6 | 6.16 | 94.4 | 111.9 | 1206 | 151 | 65 | 332 |
| 2007 | 10 | 101.2 | 9.58 | 75.0 | 108.8 | 1419 | 142 | 59 | 372 |
| 2008 | 10 | 107.2 | 3.74 | 100.2 | 112.1 | 1611 | 161 | 26 | 535 |
| 2009 | 13 | 104.2 | 6.63 | 88.7 | 111.7 | 1415 | 109 | 61 | 219 |
| 2010 | 11 | 108.0 | 7.17 | 97.1 | 121.3 | 898 | 82 | 24 | 192 |
| 2011 | 7 | 114.6 | 3.10 | 110.0 | 119.5 | 435 | 62 | 41 | 95 |
| 2012 | 4 | 106.0 | 3.88 | 101.5 | 110.3 | 344 | 86 | 57 | 110 |
| 2013 | 6 | 103.4 | 6.50 | 94.8 | 112.3 | 443 | 74 | 21 | 160 |
| 2014 | 4 | 116.9 | 5.37 | 110.2 | 122.9 | 426 | 107 | 24 | 273 |
| 2015 | 2 | 112.9 | 4.93 | 109.4 | 116.3 | 93 | 47 | 37 | 56 |
| Sum | 156 | 104.3 | 7.41 | 74.1 | 122.9 | 23122 | 148 | 21 | 853 |
| Interbul test evaluation 203r |
| Population : SVN - BSW |
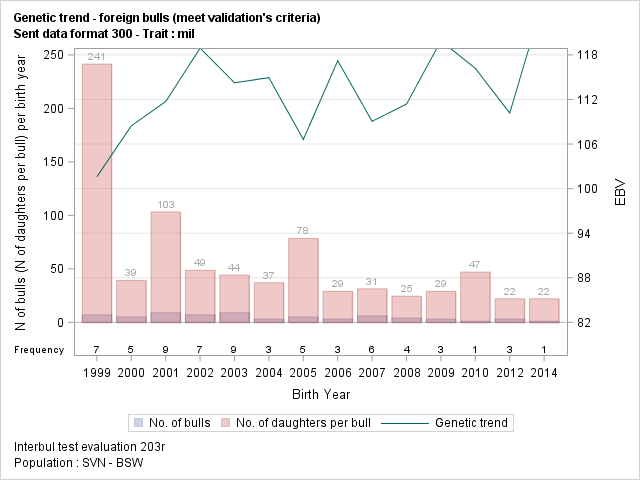
| Genetic trend - foreign bulls (meet validation's criteria) |
| Sent data format 300 - Trait : mil |
| Year | EBV | N Daughter | |||||||
|---|---|---|---|---|---|---|---|---|---|
| n Bull | Mean | Std | Min | Max | Sum | Mean | Min | Max | |
| 1999 | 7 | 101.6 | 5.06 | 92.3 | 107.2 | 1690 | 241 | 22 | 1311 |
| 2000 | 5 | 108.4 | 3.89 | 101.9 | 111.6 | 196 | 39 | 23 | 74 |
| 2001 | 9 | 111.7 | 4.29 | 105.0 | 119.2 | 929 | 103 | 20 | 600 |
| 2002 | 7 | 118.9 | 10.87 | 104.6 | 133.7 | 341 | 49 | 23 | 122 |
| 2003 | 9 | 114.2 | 7.72 | 102.9 | 128.1 | 398 | 44 | 28 | 78 |
| 2004 | 3 | 114.9 | 8.50 | 108.4 | 124.6 | 111 | 37 | 26 | 58 |
| 2005 | 5 | 106.6 | 8.83 | 93.9 | 118.3 | 392 | 78 | 20 | 196 |
| 2006 | 3 | 117.2 | 3.38 | 113.8 | 120.6 | 87 | 29 | 23 | 39 |
| 2007 | 6 | 109.1 | 6.47 | 101.0 | 119.1 | 188 | 31 | 23 | 43 |
| 2008 | 4 | 111.4 | 8.59 | 104.0 | 123.8 | 98 | 25 | 20 | 31 |
| 2009 | 3 | 119.9 | 2.89 | 116.6 | 122.1 | 87 | 29 | 29 | 29 |
| 2010 | 1 | 116.2 | 116.2 | 116.2 | 47 | 47 | 47 | 47 | |
| 2012 | 3 | 110.2 | 8.55 | 100.9 | 117.8 | 66 | 22 | 20 | 23 |
| 2014 | 1 | 125.8 | 125.8 | 125.8 | 22 | 22 | 22 | 22 | |
| Sum | 66 | 111.8 | 8.35 | 92.3 | 133.7 | 4652 | 70 | 20 | 1311 |
| Interbul test evaluation 203r |
| Population : SVN - BSW |