| No. of Bulls (birth year >= 1999) by country |
| Sent data format 300 - Trait : mil |
| Country | Year of birth | Sum | ||||||||||||||||||
|---|---|---|---|---|---|---|---|---|---|---|---|---|---|---|---|---|---|---|---|---|
| 1999 | 2000 | 2001 | 2002 | 2003 | 2004 | 2005 | 2006 | 2007 | 2008 | 2009 | 2010 | 2011 | 2012 | 2013 | 2014 | 2015 | 2016 | |||
| AUT | AUSTRIA | 1 | 1 | 4 | 3 | 1 | 2 | 1 | 1 | 3 | 4 | 6 | 2 | 1 | 2 | 4 | 1 | 37 | ||
| CZE | CZECH REPUBLIC | 1 | 1 | 1 | 3 | |||||||||||||||
| DEU | GERMANY | 6 | 8 | 9 | 13 | 8 | 8 | 8 | 12 | 5 | 6 | 8 | 9 | 4 | 8 | 8 | 6 | 7 | 133 | |
| DNK | DENMARK | 1 | 1 | |||||||||||||||||
| ITA | ITALY | 1 | 1 | 2 | ||||||||||||||||
| SVK | SLOVAKIA | 1 | 1 | |||||||||||||||||
| SVN | SLOVENIA | 21 | 21 | 18 | 17 | 21 | 23 | 16 | 23 | 19 | 18 | 19 | 21 | 19 | 19 | 18 | 14 | 13 | 1 | 321 |
| Sum | 28 | 29 | 28 | 35 | 33 | 34 | 27 | 36 | 26 | 27 | 31 | 36 | 26 | 27 | 27 | 22 | 24 | 2 | 498 | |
| Interbul test evaluation 202r |
| Population : SVN - SIM |
| No. of Bulls (birth year >= 1999) by origin |
| Sent data format 300 - Trait : mil |
| Origin | Year of birth | Sum | |||||||||||||||||
|---|---|---|---|---|---|---|---|---|---|---|---|---|---|---|---|---|---|---|---|
| 1999 | 2000 | 2001 | 2002 | 2003 | 2004 | 2005 | 2006 | 2007 | 2008 | 2009 | 2010 | 2011 | 2012 | 2013 | 2014 | 2015 | 2016 | ||
| SVN | 21 | 21 | 18 | 17 | 21 | 23 | 16 | 23 | 19 | 18 | 19 | 21 | 19 | 19 | 18 | 14 | 13 | 1 | 321 |
| Foreign | 7 | 8 | 10 | 18 | 12 | 11 | 11 | 13 | 7 | 9 | 12 | 15 | 7 | 8 | 9 | 8 | 11 | 1 | 177 |
| Sum | 28 | 29 | 28 | 35 | 33 | 34 | 27 | 36 | 26 | 27 | 31 | 36 | 26 | 27 | 27 | 22 | 24 | 2 | 498 |
| Interbul test evaluation 202r |
| Population : SVN - SIM |
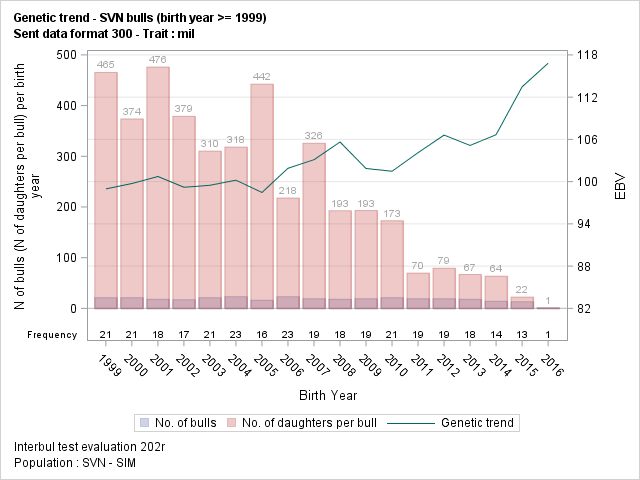
| Genetic trend - SVN bulls (birth year >= 1999) |
| Sent data format 300 - Trait : mil |
| Year | EBV | N Daughter | |||||||
|---|---|---|---|---|---|---|---|---|---|
| n Bull | Mean | Std | Min | Max | Sum | Mean | Min | Max | |
| 1999 | 21 | 99.0 | 4.74 | 90.7 | 107.3 | 9773 | 465 | 127 | 919 |
| 2000 | 21 | 99.7 | 4.85 | 92.7 | 112.3 | 7848 | 374 | 1 | 1117 |
| 2001 | 18 | 100.7 | 7.28 | 90.2 | 117.6 | 8570 | 476 | 73 | 1866 |
| 2002 | 17 | 99.2 | 4.28 | 91.1 | 107.3 | 6441 | 379 | 1 | 1361 |
| 2003 | 21 | 99.5 | 7.27 | 87.3 | 112.9 | 6515 | 310 | 29 | 1070 |
| 2004 | 23 | 100.2 | 5.06 | 91.2 | 115.8 | 7319 | 318 | 1 | 1186 |
| 2005 | 16 | 98.5 | 3.03 | 93.9 | 103.8 | 7076 | 442 | 92 | 1444 |
| 2006 | 23 | 101.9 | 4.30 | 94.6 | 111.8 | 5006 | 218 | 1 | 1480 |
| 2007 | 19 | 103.1 | 3.95 | 95.8 | 110.6 | 6189 | 326 | 77 | 723 |
| 2008 | 18 | 105.6 | 5.06 | 97.8 | 117.4 | 3466 | 193 | 1 | 980 |
| 2009 | 19 | 101.9 | 3.16 | 94.8 | 107.7 | 3667 | 193 | 1 | 645 |
| 2010 | 21 | 101.5 | 6.81 | 92.7 | 119.3 | 3631 | 173 | 3 | 529 |
| 2011 | 19 | 104.1 | 4.83 | 95.5 | 112.9 | 1322 | 70 | 5 | 113 |
| 2012 | 19 | 106.6 | 4.89 | 100.6 | 115.9 | 1505 | 79 | 42 | 175 |
| 2013 | 18 | 105.1 | 5.86 | 93.5 | 113.2 | 1201 | 67 | 30 | 112 |
| 2014 | 14 | 106.7 | 11.88 | 82.7 | 126.0 | 889 | 64 | 17 | 128 |
| 2015 | 13 | 113.5 | 15.39 | 86.9 | 145.2 | 289 | 22 | 3 | 93 |
| 2016 | 1 | 116.8 | 116.8 | 116.8 | 1 | 1 | 1 | 1 | |
| Sum | 321 | 102.5 | 7.11 | 82.7 | 145.2 | 80708 | 251 | 1 | 1866 |
| Interbul test evaluation 202r |
| Population : SVN - SIM |
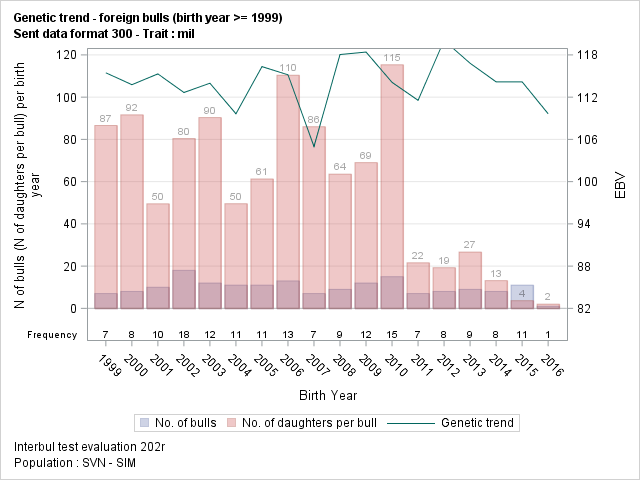
| Genetic trend - foreign bulls (birth year >= 1999) |
| Sent data format 300 - Trait : mil |
| Year | EBV | N Daughter | |||||||
|---|---|---|---|---|---|---|---|---|---|
| n Bull | Mean | Std | Min | Max | Sum | Mean | Min | Max | |
| 1999 | 7 | 115.5 | 10.15 | 99.9 | 128.3 | 606 | 87 | 9 | 200 |
| 2000 | 8 | 113.8 | 4.40 | 105.9 | 118.1 | 733 | 92 | 1 | 457 |
| 2001 | 10 | 115.3 | 3.21 | 110.6 | 119.6 | 495 | 50 | 2 | 118 |
| 2002 | 18 | 112.7 | 9.37 | 86.0 | 126.7 | 1447 | 80 | 6 | 404 |
| 2003 | 12 | 114.0 | 6.61 | 99.4 | 126.0 | 1084 | 90 | 3 | 234 |
| 2004 | 11 | 109.6 | 9.42 | 85.2 | 119.7 | 545 | 50 | 5 | 98 |
| 2005 | 11 | 116.3 | 5.73 | 108.6 | 125.5 | 674 | 61 | 20 | 120 |
| 2006 | 13 | 115.2 | 12.19 | 81.7 | 126.9 | 1435 | 110 | 5 | 343 |
| 2007 | 7 | 105.0 | 19.91 | 75.4 | 124.6 | 602 | 86 | 2 | 294 |
| 2008 | 9 | 118.1 | 9.29 | 104.9 | 129.3 | 572 | 64 | 11 | 148 |
| 2009 | 12 | 118.4 | 10.32 | 99.7 | 141.1 | 828 | 69 | 1 | 206 |
| 2010 | 15 | 114.1 | 6.36 | 103.3 | 129.8 | 1730 | 115 | 4 | 576 |
| 2011 | 7 | 111.6 | 14.84 | 83.0 | 131.5 | 151 | 22 | 1 | 62 |
| 2012 | 8 | 120.1 | 7.89 | 105.9 | 129.2 | 154 | 19 | 1 | 60 |
| 2013 | 9 | 116.8 | 7.21 | 106.2 | 125.9 | 240 | 27 | 1 | 67 |
| 2014 | 8 | 114.2 | 9.53 | 103.8 | 132.9 | 105 | 13 | 1 | 25 |
| 2015 | 11 | 114.2 | 11.14 | 93.6 | 137.0 | 40 | 4 | 1 | 10 |
| 2016 | 1 | 109.6 | 109.6 | 109.6 | 2 | 2 | 2 | 2 | |
| Sum | 177 | 114.4 | 9.64 | 75.4 | 141.1 | 11443 | 65 | 1 | 576 |
| Interbul test evaluation 202r |
| Population : SVN - SIM |
| No. of Bulls (meet validation's criteria) by country |
| Sent data format 300 - Trait : mil |
| Validation's criteria : |
| - N daughter min. : 20 |
| - N herd min. : 10 |
| - Year birth min. : 1999 |
| Country | Year of birth | Sum | |||||||||||||||||
|---|---|---|---|---|---|---|---|---|---|---|---|---|---|---|---|---|---|---|---|
| 1999 | 2000 | 2001 | 2002 | 2003 | 2004 | 2005 | 2006 | 2007 | 2008 | 2009 | 2010 | 2011 | 2012 | 2013 | 2014 | 2015 | |||
| AUT | AUSTRIA | 1 | 1 | 4 | 3 | 1 | 2 | 1 | 2 | 2 | 5 | 1 | 1 | 24 | |||||
| CZE | CZECH REPUBLIC | 1 | 1 | 2 | |||||||||||||||
| DEU | GERMANY | 5 | 6 | 6 | 11 | 6 | 7 | 8 | 10 | 4 | 6 | 6 | 8 | 3 | 3 | 5 | 1 | 95 | |
| ITA | ITALY | 1 | 1 | 2 | |||||||||||||||
| SVK | SLOVAKIA | 1 | 1 | ||||||||||||||||
| SVN | SLOVENIA | 21 | 20 | 18 | 16 | 20 | 21 | 16 | 22 | 19 | 16 | 17 | 20 | 18 | 19 | 18 | 13 | 5 | 299 |
| Sum | 27 | 26 | 25 | 32 | 30 | 31 | 27 | 33 | 23 | 24 | 25 | 33 | 22 | 22 | 24 | 14 | 5 | 423 | |
| Interbul test evaluation 202r |
| Population : SVN - SIM |
| No. of Bulls (meet validation's criteria) by origin |
| Sent data format 300 - Trait : mil |
| Origin | Year of birth | Sum | ||||||||||||||||
|---|---|---|---|---|---|---|---|---|---|---|---|---|---|---|---|---|---|---|
| 1999 | 2000 | 2001 | 2002 | 2003 | 2004 | 2005 | 2006 | 2007 | 2008 | 2009 | 2010 | 2011 | 2012 | 2013 | 2014 | 2015 | ||
| SVN | 21 | 20 | 18 | 16 | 20 | 21 | 16 | 22 | 19 | 16 | 17 | 20 | 18 | 19 | 18 | 13 | 5 | 299 |
| Foreign | 6 | 6 | 7 | 16 | 10 | 10 | 11 | 11 | 4 | 8 | 8 | 13 | 4 | 3 | 6 | 1 | 124 | |
| Sum | 27 | 26 | 25 | 32 | 30 | 31 | 27 | 33 | 23 | 24 | 25 | 33 | 22 | 22 | 24 | 14 | 5 | 423 |
| Interbul test evaluation 202r |
| Population : SVN - SIM |
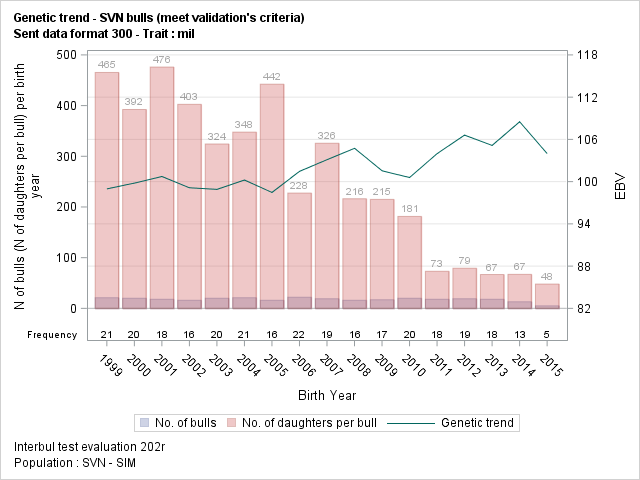
| Genetic trend - SVN bulls (meet validation's criteria) |
| Sent data format 300 - Trait : mil |
| Year | EBV | N Daughter | |||||||
|---|---|---|---|---|---|---|---|---|---|
| n Bull | Mean | Std | Min | Max | Sum | Mean | Min | Max | |
| 1999 | 21 | 99.0 | 4.74 | 90.7 | 107.3 | 9773 | 465 | 127 | 919 |
| 2000 | 20 | 99.8 | 4.97 | 92.7 | 112.3 | 7847 | 392 | 48 | 1117 |
| 2001 | 18 | 100.7 | 7.28 | 90.2 | 117.6 | 8570 | 476 | 73 | 1866 |
| 2002 | 16 | 99.1 | 4.41 | 91.1 | 107.3 | 6440 | 403 | 125 | 1361 |
| 2003 | 20 | 98.9 | 6.92 | 87.3 | 112.9 | 6486 | 324 | 103 | 1070 |
| 2004 | 21 | 100.2 | 4.51 | 92.0 | 115.8 | 7302 | 348 | 107 | 1186 |
| 2005 | 16 | 98.5 | 3.03 | 93.9 | 103.8 | 7076 | 442 | 92 | 1444 |
| 2006 | 22 | 101.5 | 3.82 | 94.6 | 108.5 | 5005 | 228 | 74 | 1480 |
| 2007 | 19 | 103.1 | 3.95 | 95.8 | 110.6 | 6189 | 326 | 77 | 723 |
| 2008 | 16 | 104.7 | 4.31 | 97.8 | 111.6 | 3460 | 216 | 32 | 980 |
| 2009 | 17 | 101.5 | 3.00 | 94.8 | 106.8 | 3655 | 215 | 74 | 645 |
| 2010 | 20 | 100.6 | 5.59 | 92.7 | 112.2 | 3628 | 181 | 35 | 529 |
| 2011 | 18 | 104.0 | 4.93 | 95.5 | 112.9 | 1317 | 73 | 32 | 113 |
| 2012 | 19 | 106.6 | 4.89 | 100.6 | 115.9 | 1505 | 79 | 42 | 175 |
| 2013 | 18 | 105.1 | 5.86 | 93.5 | 113.2 | 1201 | 67 | 30 | 112 |
| 2014 | 13 | 108.5 | 10.07 | 86.4 | 126.0 | 872 | 67 | 35 | 128 |
| 2015 | 5 | 104.0 | 11.30 | 86.9 | 114.6 | 240 | 48 | 21 | 93 |
| Sum | 299 | 101.9 | 5.98 | 86.4 | 126.0 | 80566 | 269 | 21 | 1866 |
| Interbul test evaluation 202r |
| Population : SVN - SIM |
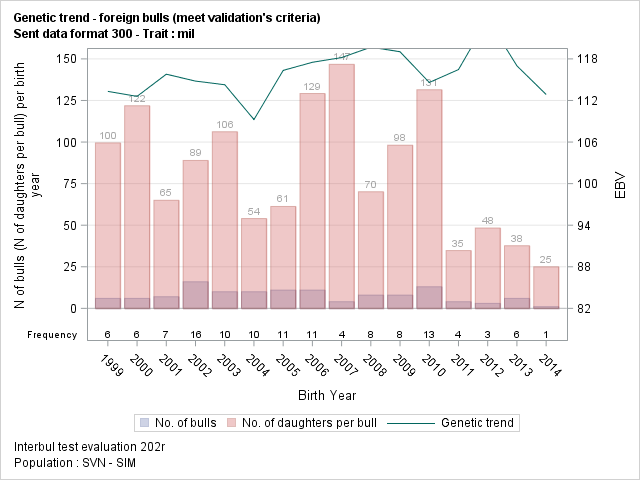
| Genetic trend - foreign bulls (meet validation's criteria) |
| Sent data format 300 - Trait : mil |
| Year | EBV | N Daughter | |||||||
|---|---|---|---|---|---|---|---|---|---|
| n Bull | Mean | Std | Min | Max | Sum | Mean | Min | Max | |
| 1999 | 6 | 113.3 | 9.22 | 99.9 | 123.5 | 597 | 100 | 34 | 200 |
| 2000 | 6 | 112.6 | 4.50 | 105.9 | 118.1 | 731 | 122 | 29 | 457 |
| 2001 | 7 | 115.8 | 3.34 | 110.6 | 119.6 | 455 | 65 | 21 | 118 |
| 2002 | 16 | 114.8 | 6.59 | 103.1 | 126.7 | 1423 | 89 | 33 | 404 |
| 2003 | 10 | 114.3 | 6.99 | 99.4 | 126.0 | 1062 | 106 | 28 | 234 |
| 2004 | 10 | 109.3 | 9.84 | 85.2 | 119.7 | 540 | 54 | 23 | 98 |
| 2005 | 11 | 116.3 | 5.73 | 108.6 | 125.5 | 674 | 61 | 20 | 120 |
| 2006 | 11 | 117.5 | 7.35 | 106.9 | 126.9 | 1421 | 129 | 21 | 343 |
| 2007 | 4 | 118.2 | 7.48 | 107.4 | 124.6 | 587 | 147 | 30 | 294 |
| 2008 | 8 | 119.7 | 8.43 | 105.7 | 129.3 | 561 | 70 | 24 | 148 |
| 2009 | 8 | 119.0 | 9.47 | 112.1 | 141.1 | 785 | 98 | 22 | 206 |
| 2010 | 13 | 114.6 | 6.58 | 103.3 | 129.8 | 1709 | 131 | 24 | 576 |
| 2011 | 4 | 116.5 | 10.98 | 107.3 | 131.5 | 139 | 35 | 21 | 62 |
| 2012 | 3 | 123.8 | 6.68 | 116.3 | 129.2 | 145 | 48 | 30 | 60 |
| 2013 | 6 | 117.0 | 7.16 | 108.5 | 125.9 | 226 | 38 | 20 | 67 |
| 2014 | 1 | 112.9 | 112.9 | 112.9 | 25 | 25 | 25 | 25 | |
| Sum | 124 | 115.6 | 7.54 | 85.2 | 141.1 | 11080 | 89 | 20 | 576 |
| Interbul test evaluation 202r |
| Population : SVN - SIM |