| No. of Bulls (birth year >= 1999) by country |
| Sent data format 300 - Trait : mil |
| Country | Year of birth | Sum | ||||||||||||||||
|---|---|---|---|---|---|---|---|---|---|---|---|---|---|---|---|---|---|---|
| 1999 | 2000 | 2001 | 2002 | 2003 | 2004 | 2005 | 2006 | 2007 | 2008 | 2009 | 2010 | 2011 | 2012 | 2013 | 2014 | |||
| AUT | AUSTRIA | 1 | 1 | 1 | 1 | 2 | 6 | |||||||||||
| CHE | SWITZERLAND | 1 | 1 | 1 | 7 | 2 | 3 | 5 | 2 | 2 | 1 | 2 | 2 | 2 | 31 | |||
| DEU | GERMANY | 2 | 3 | 4 | 4 | 6 | 1 | 6 | 3 | 2 | 3 | 2 | 2 | 1 | 4 | 2 | 2 | 47 |
| ITA | ITALY | 5 | 1 | 4 | 1 | 1 | 3 | 2 | 2 | 1 | 1 | 2 | 23 | |||||
| SVN | SLOVENIA | 12 | 12 | 10 | 11 | 14 | 10 | 15 | 8 | 10 | 10 | 13 | 13 | 8 | 5 | 6 | 6 | 163 |
| USA | USA | 1 | 1 | 1 | 1 | 1 | 1 | 1 | 2 | 1 | 10 | |||||||
| Sum | 20 | 18 | 21 | 19 | 28 | 15 | 29 | 14 | 19 | 17 | 17 | 18 | 9 | 13 | 11 | 12 | 280 | |
| Interbul test evaluation 193r |
| Population : SVN - BSW |
| No. of Bulls (birth year >= 1999) by origin |
| Sent data format 300 - Trait : mil |
| Origin | Year of birth | Sum | |||||||||||||||
|---|---|---|---|---|---|---|---|---|---|---|---|---|---|---|---|---|---|
| 1999 | 2000 | 2001 | 2002 | 2003 | 2004 | 2005 | 2006 | 2007 | 2008 | 2009 | 2010 | 2011 | 2012 | 2013 | 2014 | ||
| SVN | 12 | 12 | 10 | 11 | 14 | 10 | 15 | 8 | 10 | 10 | 13 | 13 | 8 | 5 | 6 | 6 | 163 |
| Foreign | 8 | 6 | 11 | 8 | 14 | 5 | 14 | 6 | 9 | 7 | 4 | 5 | 1 | 8 | 5 | 6 | 117 |
| Sum | 20 | 18 | 21 | 19 | 28 | 15 | 29 | 14 | 19 | 17 | 17 | 18 | 9 | 13 | 11 | 12 | 280 |
| Interbul test evaluation 193r |
| Population : SVN - BSW |
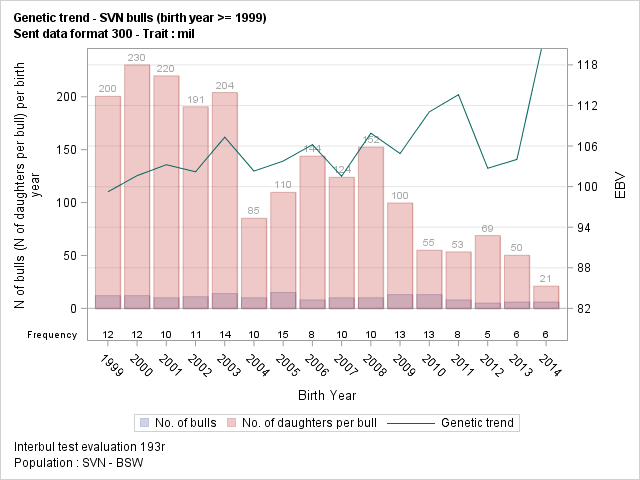
| Genetic trend - SVN bulls (birth year >= 1999) |
| Sent data format 300 - Trait : mil |
| Year | EBV | N Daughter | |||||||
|---|---|---|---|---|---|---|---|---|---|
| n Bull | Mean | Std | Min | Max | Sum | Mean | Min | Max | |
| 1999 | 12 | 99.2 | 8.49 | 74.3 | 106.9 | 2405 | 200 | 83 | 449 |
| 2000 | 12 | 101.6 | 5.76 | 87.8 | 108.5 | 2762 | 230 | 8 | 741 |
| 2001 | 10 | 103.2 | 4.53 | 93.5 | 111.5 | 2198 | 220 | 83 | 676 |
| 2002 | 11 | 102.2 | 3.76 | 94.5 | 107.5 | 2096 | 191 | 51 | 734 |
| 2003 | 14 | 107.3 | 7.70 | 96.4 | 123.9 | 2856 | 204 | 1 | 850 |
| 2004 | 10 | 102.3 | 8.28 | 90.1 | 115.1 | 852 | 85 | 21 | 165 |
| 2005 | 15 | 103.8 | 7.60 | 83.2 | 111.6 | 1645 | 110 | 18 | 379 |
| 2006 | 8 | 106.2 | 6.15 | 94.9 | 112.2 | 1151 | 144 | 65 | 320 |
| 2007 | 10 | 101.5 | 9.34 | 76.2 | 109.8 | 1239 | 124 | 57 | 266 |
| 2008 | 10 | 107.9 | 3.73 | 100.6 | 113.1 | 1524 | 152 | 26 | 513 |
| 2009 | 13 | 104.9 | 6.62 | 88.7 | 113.7 | 1295 | 100 | 60 | 173 |
| 2010 | 13 | 111.0 | 8.31 | 97.7 | 123.4 | 715 | 55 | 1 | 120 |
| 2011 | 8 | 113.6 | 4.75 | 106.9 | 121.6 | 427 | 53 | 10 | 87 |
| 2012 | 5 | 102.7 | 11.16 | 83.5 | 111.9 | 344 | 69 | 17 | 102 |
| 2013 | 6 | 104.0 | 8.96 | 90.3 | 113.7 | 301 | 50 | 10 | 109 |
| 2014 | 6 | 123.5 | 10.61 | 107.7 | 138.2 | 126 | 21 | 1 | 86 |
| Sum | 163 | 105.4 | 8.60 | 74.3 | 138.2 | 21936 | 135 | 1 | 850 |
| Interbul test evaluation 193r |
| Population : SVN - BSW |
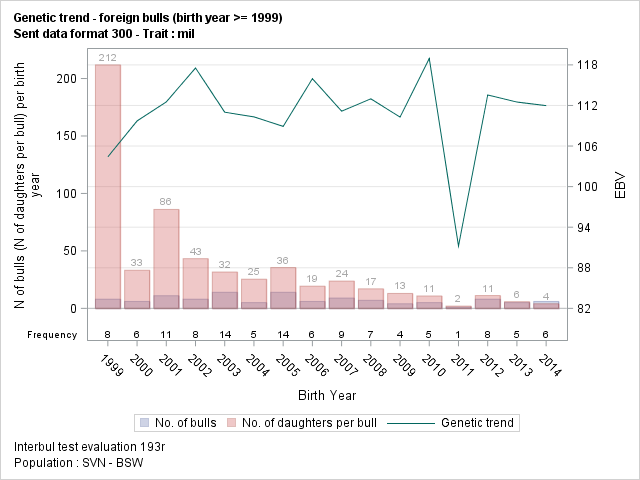
| Genetic trend - foreign bulls (birth year >= 1999) |
| Sent data format 300 - Trait : mil |
| Year | EBV | N Daughter | |||||||
|---|---|---|---|---|---|---|---|---|---|
| n Bull | Mean | Std | Min | Max | Sum | Mean | Min | Max | |
| 1999 | 8 | 104.4 | 8.25 | 92.2 | 120.7 | 1695 | 212 | 5 | 1311 |
| 2000 | 6 | 109.7 | 4.95 | 101.0 | 115.5 | 199 | 33 | 3 | 74 |
| 2001 | 11 | 112.5 | 5.05 | 106.3 | 122.1 | 947 | 86 | 11 | 598 |
| 2002 | 8 | 117.5 | 11.05 | 103.7 | 134.2 | 346 | 43 | 8 | 119 |
| 2003 | 14 | 111.0 | 9.16 | 96.2 | 129.6 | 443 | 32 | 1 | 78 |
| 2004 | 5 | 110.3 | 9.15 | 99.2 | 124.4 | 127 | 25 | 5 | 53 |
| 2005 | 14 | 108.9 | 6.79 | 94.3 | 120.4 | 497 | 36 | 6 | 194 |
| 2006 | 6 | 116.0 | 2.97 | 111.8 | 119.5 | 116 | 19 | 3 | 39 |
| 2007 | 9 | 111.2 | 9.83 | 91.3 | 124.1 | 214 | 24 | 12 | 39 |
| 2008 | 7 | 113.0 | 8.89 | 104.8 | 125.6 | 119 | 17 | 9 | 22 |
| 2009 | 4 | 110.3 | 6.05 | 102.7 | 117.1 | 52 | 13 | 9 | 15 |
| 2010 | 5 | 118.9 | 15.62 | 99.8 | 143.4 | 54 | 11 | 2 | 42 |
| 2011 | 1 | 91.2 | 91.2 | 91.2 | 2 | 2 | 2 | 2 | |
| 2012 | 8 | 113.5 | 8.67 | 98.5 | 127.0 | 78 | 11 | 2 | 19 |
| 2013 | 5 | 112.5 | 17.50 | 98.1 | 140.2 | 29 | 6 | 2 | 11 |
| 2014 | 6 | 112.0 | 6.20 | 101.9 | 120.8 | 24 | 4 | 1 | 8 |
| Sum | 117 | 111.6 | 9.17 | 91.2 | 143.4 | 4942 | 43 | 1 | 1311 |
| Interbul test evaluation 193r |
| Population : SVN - BSW |
| No. of Bulls (meet validation's criteria) by country |
| Sent data format 300 - Trait : mil |
| Validation's criteria : |
| - N daughter min. : 20 |
| - N herd min. : 10 |
| - Year birth min. : 1999 |
| Country | Year of birth | Sum | ||||||||||||||||
|---|---|---|---|---|---|---|---|---|---|---|---|---|---|---|---|---|---|---|
| 1999 | 2000 | 2001 | 2002 | 2003 | 2004 | 2005 | 2006 | 2007 | 2008 | 2009 | 2010 | 2011 | 2012 | 2013 | 2014 | |||
| AUT | AUSTRIA | 1 | 1 | 1 | 1 | 2 | 6 | |||||||||||
| CHE | SWITZERLAND | 1 | 1 | 1 | 3 | 1 | 3 | 2 | 1 | 13 | ||||||||
| DEU | GERMANY | 1 | 2 | 2 | 4 | 5 | 1 | 1 | 1 | 17 | ||||||||
| ITA | ITALY | 5 | 1 | 4 | 1 | 2 | 2 | 15 | ||||||||||
| SVN | SLOVENIA | 12 | 11 | 10 | 11 | 13 | 10 | 14 | 8 | 10 | 10 | 13 | 10 | 7 | 4 | 5 | 2 | 150 |
| USA | USA | 1 | 1 | 1 | 1 | 1 | 5 | |||||||||||
| Sum | 19 | 16 | 19 | 18 | 22 | 13 | 18 | 11 | 16 | 12 | 13 | 11 | 7 | 4 | 5 | 2 | 206 | |
| Interbul test evaluation 193r |
| Population : SVN - BSW |
| No. of Bulls (meet validation's criteria) by origin |
| Sent data format 300 - Trait : mil |
| Origin | Year of birth | Sum | |||||||||||||||
|---|---|---|---|---|---|---|---|---|---|---|---|---|---|---|---|---|---|
| 1999 | 2000 | 2001 | 2002 | 2003 | 2004 | 2005 | 2006 | 2007 | 2008 | 2009 | 2010 | 2011 | 2012 | 2013 | 2014 | ||
| SVN | 12 | 11 | 10 | 11 | 13 | 10 | 14 | 8 | 10 | 10 | 13 | 10 | 7 | 4 | 5 | 2 | 150 |
| Foreign | 7 | 5 | 9 | 7 | 9 | 3 | 4 | 3 | 6 | 2 | 1 | 56 | |||||
| Sum | 19 | 16 | 19 | 18 | 22 | 13 | 18 | 11 | 16 | 12 | 13 | 11 | 7 | 4 | 5 | 2 | 206 |
| Interbul test evaluation 193r |
| Population : SVN - BSW |
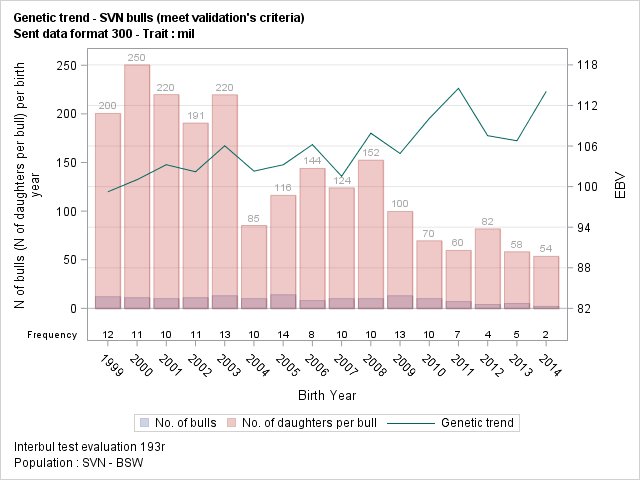
| Genetic trend - SVN bulls (meet validation's criteria) |
| Sent data format 300 - Trait : mil |
| Year | EBV | N Daughter | |||||||
|---|---|---|---|---|---|---|---|---|---|
| n Bull | Mean | Std | Min | Max | Sum | Mean | Min | Max | |
| 1999 | 12 | 99.2 | 8.49 | 74.3 | 106.9 | 2405 | 200 | 83 | 449 |
| 2000 | 11 | 101.0 | 5.64 | 87.8 | 108.5 | 2754 | 250 | 96 | 741 |
| 2001 | 10 | 103.2 | 4.53 | 93.5 | 111.5 | 2198 | 220 | 83 | 676 |
| 2002 | 11 | 102.2 | 3.76 | 94.5 | 107.5 | 2096 | 191 | 51 | 734 |
| 2003 | 13 | 106.0 | 6.30 | 96.4 | 116.2 | 2855 | 220 | 57 | 850 |
| 2004 | 10 | 102.3 | 8.28 | 90.1 | 115.1 | 852 | 85 | 21 | 165 |
| 2005 | 14 | 103.2 | 7.57 | 83.2 | 110.4 | 1627 | 116 | 24 | 379 |
| 2006 | 8 | 106.2 | 6.15 | 94.9 | 112.2 | 1151 | 144 | 65 | 320 |
| 2007 | 10 | 101.5 | 9.34 | 76.2 | 109.8 | 1239 | 124 | 57 | 266 |
| 2008 | 10 | 107.9 | 3.73 | 100.6 | 113.1 | 1524 | 152 | 26 | 513 |
| 2009 | 13 | 104.9 | 6.62 | 88.7 | 113.7 | 1295 | 100 | 60 | 173 |
| 2010 | 10 | 110.1 | 6.69 | 97.7 | 122.1 | 695 | 70 | 38 | 120 |
| 2011 | 7 | 114.5 | 4.24 | 109.1 | 121.6 | 417 | 60 | 39 | 87 |
| 2012 | 4 | 107.5 | 3.44 | 104.5 | 111.9 | 327 | 82 | 55 | 102 |
| 2013 | 5 | 106.8 | 6.59 | 98.1 | 113.7 | 291 | 58 | 30 | 109 |
| 2014 | 2 | 114.1 | 8.96 | 107.7 | 120.4 | 107 | 54 | 21 | 86 |
| Sum | 150 | 104.7 | 7.28 | 74.3 | 122.1 | 21833 | 146 | 21 | 850 |
| Interbul test evaluation 193r |
| Population : SVN - BSW |
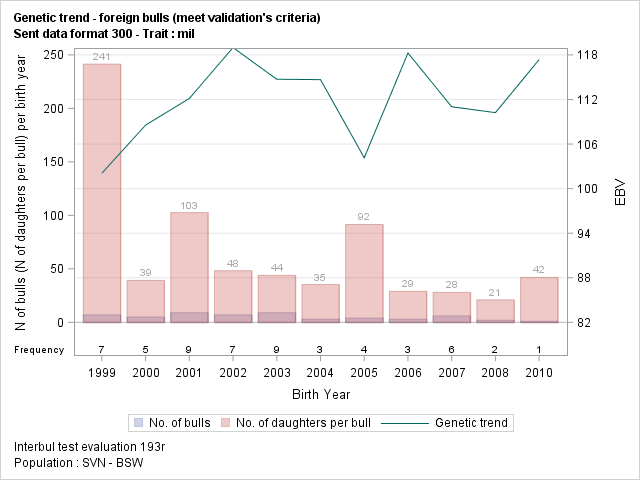
| Genetic trend - foreign bulls (meet validation's criteria) |
| Sent data format 300 - Trait : mil |
| Year | EBV | N Daughter | |||||||
|---|---|---|---|---|---|---|---|---|---|
| n Bull | Mean | Std | Min | Max | Sum | Mean | Min | Max | |
| 1999 | 7 | 102.1 | 5.35 | 92.2 | 107.8 | 1690 | 241 | 22 | 1311 |
| 2000 | 5 | 108.6 | 4.53 | 101.0 | 112.4 | 196 | 39 | 23 | 74 |
| 2001 | 9 | 112.1 | 3.93 | 106.4 | 119.7 | 923 | 103 | 20 | 598 |
| 2002 | 7 | 119.0 | 11.09 | 103.7 | 134.2 | 338 | 48 | 23 | 119 |
| 2003 | 9 | 114.7 | 7.99 | 103.2 | 129.6 | 395 | 44 | 28 | 78 |
| 2004 | 3 | 114.7 | 8.71 | 107.7 | 124.4 | 106 | 35 | 26 | 53 |
| 2005 | 4 | 104.2 | 6.88 | 94.3 | 110.2 | 366 | 92 | 34 | 194 |
| 2006 | 3 | 118.2 | 1.95 | 116.0 | 119.5 | 87 | 29 | 23 | 39 |
| 2007 | 6 | 111.0 | 5.50 | 101.7 | 117.4 | 168 | 28 | 20 | 39 |
| 2008 | 2 | 110.2 | 2.11 | 108.7 | 111.7 | 42 | 21 | 20 | 22 |
| 2010 | 1 | 117.4 | 117.4 | 117.4 | 42 | 42 | 42 | 42 | |
| Sum | 56 | 111.6 | 8.15 | 92.2 | 134.2 | 4353 | 78 | 20 | 1311 |
| Interbul test evaluation 193r |
| Population : SVN - BSW |