| No. of Bulls (birth year >= 1999) by country |
| Sent data format 300 - Trait : mil |
| Country | Year of birth | Sum | ||||||||||||||||
|---|---|---|---|---|---|---|---|---|---|---|---|---|---|---|---|---|---|---|
| 1999 | 2000 | 2001 | 2002 | 2003 | 2004 | 2005 | 2006 | 2007 | 2008 | 2009 | 2010 | 2011 | 2012 | 2013 | 2014 | |||
| AUT | AUSTRIA | 1 | 1 | 1 | 1 | 2 | 6 | |||||||||||
| CHE | SWITZERLAND | 1 | 1 | 1 | 6 | 2 | 3 | 5 | 2 | 2 | 1 | 2 | 2 | 1 | 29 | |||
| DEU | GERMANY | 2 | 3 | 4 | 4 | 6 | 1 | 6 | 3 | 2 | 3 | 2 | 2 | 1 | 4 | 1 | 1 | 45 |
| ITA | ITALY | 5 | 1 | 4 | 1 | 1 | 3 | 2 | 2 | 1 | 1 | 21 | ||||||
| SVN | SLOVENIA | 12 | 12 | 10 | 11 | 14 | 10 | 15 | 8 | 10 | 10 | 13 | 13 | 8 | 5 | 6 | 4 | 161 |
| USA | USA | 1 | 1 | 1 | 1 | 1 | 1 | 2 | 1 | 9 | ||||||||
| Sum | 20 | 18 | 21 | 19 | 27 | 15 | 29 | 14 | 19 | 17 | 17 | 17 | 9 | 13 | 10 | 6 | 271 | |
| Interbul test evaluation 192r |
| Population : SVN - BSW |
| No. of Bulls (birth year >= 1999) by origin |
| Sent data format 300 - Trait : mil |
| Origin | Year of birth | Sum | |||||||||||||||
|---|---|---|---|---|---|---|---|---|---|---|---|---|---|---|---|---|---|
| 1999 | 2000 | 2001 | 2002 | 2003 | 2004 | 2005 | 2006 | 2007 | 2008 | 2009 | 2010 | 2011 | 2012 | 2013 | 2014 | ||
| SVN | 12 | 12 | 10 | 11 | 14 | 10 | 15 | 8 | 10 | 10 | 13 | 13 | 8 | 5 | 6 | 4 | 161 |
| Foreign | 8 | 6 | 11 | 8 | 13 | 5 | 14 | 6 | 9 | 7 | 4 | 4 | 1 | 8 | 4 | 2 | 110 |
| Sum | 20 | 18 | 21 | 19 | 27 | 15 | 29 | 14 | 19 | 17 | 17 | 17 | 9 | 13 | 10 | 6 | 271 |
| Interbul test evaluation 192r |
| Population : SVN - BSW |
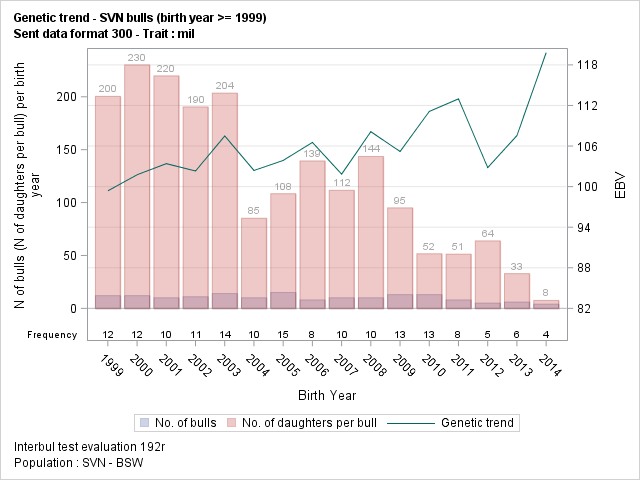
| Genetic trend - SVN bulls (birth year >= 1999) |
| Sent data format 300 - Trait : mil |
| Year | EBV | N Daughter | |||||||
|---|---|---|---|---|---|---|---|---|---|
| n Bull | Mean | Std | Min | Max | Sum | Mean | Min | Max | |
| 1999 | 12 | 99.4 | 8.56 | 74.3 | 107.1 | 2405 | 200 | 83 | 449 |
| 2000 | 12 | 101.8 | 5.78 | 87.8 | 108.6 | 2762 | 230 | 8 | 741 |
| 2001 | 10 | 103.4 | 4.54 | 93.6 | 111.7 | 2198 | 220 | 83 | 676 |
| 2002 | 11 | 102.3 | 3.79 | 94.6 | 107.9 | 2095 | 190 | 51 | 734 |
| 2003 | 14 | 107.5 | 7.78 | 96.6 | 124.2 | 2849 | 204 | 1 | 847 |
| 2004 | 10 | 102.4 | 8.34 | 90.2 | 115.2 | 852 | 85 | 21 | 165 |
| 2005 | 15 | 103.9 | 7.64 | 83.2 | 111.7 | 1626 | 108 | 18 | 360 |
| 2006 | 8 | 106.5 | 6.21 | 95.0 | 112.0 | 1115 | 139 | 65 | 308 |
| 2007 | 10 | 101.8 | 9.65 | 75.9 | 111.1 | 1116 | 112 | 57 | 230 |
| 2008 | 10 | 108.1 | 3.85 | 100.0 | 113.0 | 1436 | 144 | 26 | 470 |
| 2009 | 13 | 105.2 | 6.70 | 89.5 | 114.7 | 1235 | 95 | 60 | 153 |
| 2010 | 13 | 111.1 | 8.47 | 97.9 | 123.4 | 671 | 52 | 1 | 105 |
| 2011 | 8 | 113.0 | 4.51 | 106.5 | 119.9 | 410 | 51 | 10 | 80 |
| 2012 | 5 | 102.8 | 12.63 | 80.9 | 111.7 | 319 | 64 | 14 | 100 |
| 2013 | 6 | 107.5 | 4.95 | 102.1 | 113.0 | 197 | 33 | 2 | 79 |
| 2014 | 4 | 119.8 | 19.24 | 91.1 | 131.0 | 30 | 8 | 2 | 19 |
| Sum | 161 | 105.4 | 8.40 | 74.3 | 131.0 | 21316 | 132 | 1 | 847 |
| Interbul test evaluation 192r |
| Population : SVN - BSW |
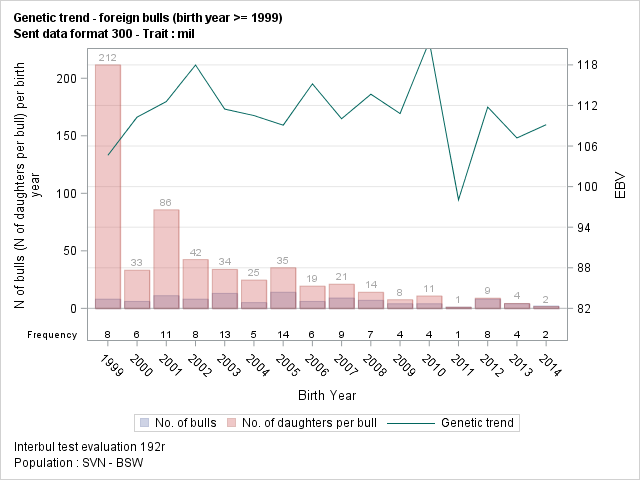
| Genetic trend - foreign bulls (birth year >= 1999) |
| Sent data format 300 - Trait : mil |
| Year | EBV | N Daughter | |||||||
|---|---|---|---|---|---|---|---|---|---|
| n Bull | Mean | Std | Min | Max | Sum | Mean | Min | Max | |
| 1999 | 8 | 104.6 | 8.24 | 92.5 | 120.8 | 1693 | 212 | 5 | 1310 |
| 2000 | 6 | 110.3 | 4.75 | 102.2 | 116.5 | 199 | 33 | 3 | 74 |
| 2001 | 11 | 112.6 | 5.20 | 106.6 | 122.2 | 942 | 86 | 11 | 595 |
| 2002 | 8 | 118.0 | 11.15 | 103.6 | 133.9 | 339 | 42 | 8 | 112 |
| 2003 | 13 | 111.5 | 9.06 | 97.0 | 129.0 | 440 | 34 | 4 | 78 |
| 2004 | 5 | 110.5 | 8.58 | 99.9 | 123.8 | 123 | 25 | 5 | 50 |
| 2005 | 14 | 109.1 | 6.51 | 94.3 | 119.8 | 494 | 35 | 6 | 194 |
| 2006 | 6 | 115.2 | 3.25 | 111.1 | 120.1 | 116 | 19 | 3 | 39 |
| 2007 | 9 | 110.0 | 10.57 | 88.9 | 123.9 | 189 | 21 | 12 | 37 |
| 2008 | 7 | 113.7 | 8.78 | 103.6 | 126.0 | 98 | 14 | 3 | 19 |
| 2009 | 4 | 110.8 | 7.32 | 104.6 | 120.7 | 30 | 8 | 7 | 8 |
| 2010 | 4 | 121.5 | 13.25 | 113.0 | 140.9 | 43 | 11 | 2 | 37 |
| 2011 | 1 | 98.0 | 98.0 | 98.0 | 1 | 1 | 1 | 1 | |
| 2012 | 8 | 111.8 | 9.58 | 93.1 | 123.6 | 62 | 9 | 1 | 17 |
| 2013 | 4 | 107.2 | 12.54 | 96.5 | 123.8 | 17 | 4 | 1 | 10 |
| 2014 | 2 | 109.2 | 10.45 | 101.8 | 116.5 | 3 | 2 | 1 | 2 |
| Sum | 110 | 111.4 | 8.83 | 88.9 | 140.9 | 4789 | 44 | 1 | 1310 |
| Interbul test evaluation 192r |
| Population : SVN - BSW |
| No. of Bulls (meet validation's criteria) by country |
| Sent data format 300 - Trait : mil |
| Validation's criteria : |
| - N daughter min. : 20 |
| - N herd min. : 10 |
| - Year birth min. : 1999 |
| Country | Year of birth | Sum | |||||||||||||||
|---|---|---|---|---|---|---|---|---|---|---|---|---|---|---|---|---|---|
| 1999 | 2000 | 2001 | 2002 | 2003 | 2004 | 2005 | 2006 | 2007 | 2008 | 2009 | 2010 | 2011 | 2012 | 2013 | |||
| AUT | AUSTRIA | 1 | 1 | 1 | 1 | 2 | 6 | ||||||||||
| CHE | SWITZERLAND | 1 | 1 | 1 | 3 | 1 | 3 | 1 | 11 | ||||||||
| DEU | GERMANY | 1 | 2 | 2 | 4 | 5 | 1 | 1 | 1 | 17 | |||||||
| ITA | ITALY | 5 | 1 | 4 | 1 | 2 | 13 | ||||||||||
| SVN | SLOVENIA | 12 | 11 | 10 | 11 | 13 | 10 | 14 | 8 | 10 | 10 | 13 | 10 | 7 | 4 | 3 | 146 |
| USA | USA | 1 | 1 | 1 | 1 | 1 | 5 | ||||||||||
| Sum | 19 | 16 | 19 | 18 | 22 | 13 | 18 | 11 | 14 | 10 | 13 | 11 | 7 | 4 | 3 | 198 | |
| Interbul test evaluation 192r |
| Population : SVN - BSW |
| No. of Bulls (meet validation's criteria) by origin |
| Sent data format 300 - Trait : mil |
| Origin | Year of birth | Sum | ||||||||||||||
|---|---|---|---|---|---|---|---|---|---|---|---|---|---|---|---|---|
| 1999 | 2000 | 2001 | 2002 | 2003 | 2004 | 2005 | 2006 | 2007 | 2008 | 2009 | 2010 | 2011 | 2012 | 2013 | ||
| SVN | 12 | 11 | 10 | 11 | 13 | 10 | 14 | 8 | 10 | 10 | 13 | 10 | 7 | 4 | 3 | 146 |
| Foreign | 7 | 5 | 9 | 7 | 9 | 3 | 4 | 3 | 4 | 1 | 52 | |||||
| Sum | 19 | 16 | 19 | 18 | 22 | 13 | 18 | 11 | 14 | 10 | 13 | 11 | 7 | 4 | 3 | 198 |
| Interbul test evaluation 192r |
| Population : SVN - BSW |
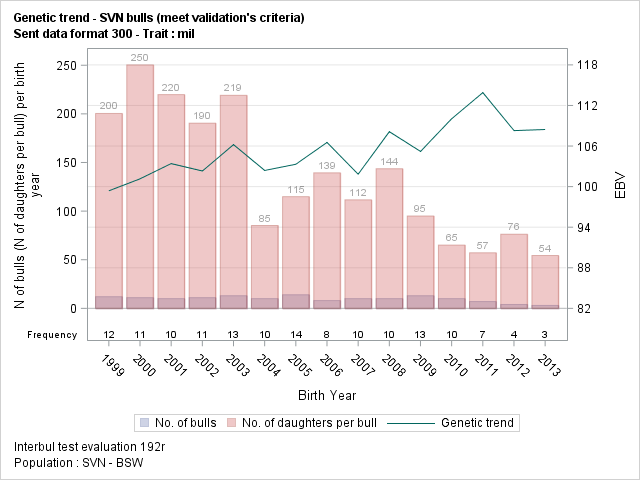
| Genetic trend - SVN bulls (meet validation's criteria) |
| Sent data format 300 - Trait : mil |
| Year | EBV | N Daughter | |||||||
|---|---|---|---|---|---|---|---|---|---|
| n Bull | Mean | Std | Min | Max | Sum | Mean | Min | Max | |
| 1999 | 12 | 99.4 | 8.56 | 74.3 | 107.1 | 2405 | 200 | 83 | 449 |
| 2000 | 11 | 101.2 | 5.66 | 87.8 | 108.6 | 2754 | 250 | 96 | 741 |
| 2001 | 10 | 103.4 | 4.54 | 93.6 | 111.7 | 2198 | 220 | 83 | 676 |
| 2002 | 11 | 102.3 | 3.79 | 94.6 | 107.9 | 2095 | 190 | 51 | 734 |
| 2003 | 13 | 106.2 | 6.36 | 96.6 | 116.4 | 2848 | 219 | 57 | 847 |
| 2004 | 10 | 102.4 | 8.34 | 90.2 | 115.2 | 852 | 85 | 21 | 165 |
| 2005 | 14 | 103.3 | 7.60 | 83.2 | 110.7 | 1608 | 115 | 24 | 360 |
| 2006 | 8 | 106.5 | 6.21 | 95.0 | 112.0 | 1115 | 139 | 65 | 308 |
| 2007 | 10 | 101.8 | 9.65 | 75.9 | 111.1 | 1116 | 112 | 57 | 230 |
| 2008 | 10 | 108.1 | 3.85 | 100.0 | 113.0 | 1436 | 144 | 26 | 470 |
| 2009 | 13 | 105.2 | 6.70 | 89.5 | 114.7 | 1235 | 95 | 60 | 153 |
| 2010 | 10 | 110.0 | 6.95 | 97.9 | 123.0 | 651 | 65 | 37 | 105 |
| 2011 | 7 | 113.9 | 3.96 | 108.3 | 119.9 | 400 | 57 | 39 | 80 |
| 2012 | 4 | 108.3 | 3.65 | 105.0 | 111.7 | 305 | 76 | 51 | 100 |
| 2013 | 3 | 108.5 | 5.11 | 102.6 | 111.5 | 163 | 54 | 35 | 79 |
| Sum | 146 | 104.7 | 7.23 | 74.3 | 123.0 | 21181 | 145 | 21 | 847 |
| Interbul test evaluation 192r |
| Population : SVN - BSW |
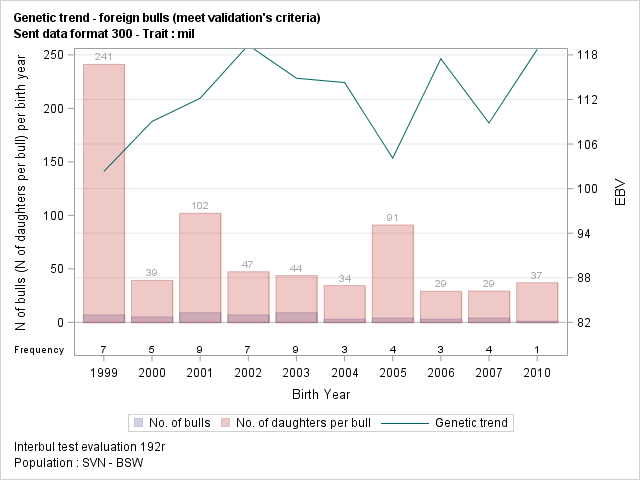
| Genetic trend - foreign bulls (meet validation's criteria) |
| Sent data format 300 - Trait : mil |
| Year | EBV | N Daughter | |||||||
|---|---|---|---|---|---|---|---|---|---|
| n Bull | Mean | Std | Min | Max | Sum | Mean | Min | Max | |
| 1999 | 7 | 102.3 | 5.41 | 92.5 | 108.3 | 1688 | 241 | 21 | 1310 |
| 2000 | 5 | 109.0 | 4.07 | 102.2 | 112.4 | 196 | 39 | 23 | 74 |
| 2001 | 9 | 112.2 | 4.18 | 106.7 | 120.0 | 918 | 102 | 20 | 595 |
| 2002 | 7 | 119.3 | 11.33 | 103.6 | 133.9 | 331 | 47 | 23 | 112 |
| 2003 | 9 | 114.9 | 7.78 | 103.5 | 129.0 | 393 | 44 | 28 | 78 |
| 2004 | 3 | 114.3 | 8.34 | 108.1 | 123.8 | 103 | 34 | 26 | 50 |
| 2005 | 4 | 104.1 | 6.66 | 94.3 | 109.4 | 364 | 91 | 32 | 194 |
| 2006 | 3 | 117.5 | 2.59 | 114.9 | 120.1 | 87 | 29 | 23 | 39 |
| 2007 | 4 | 108.8 | 7.15 | 99.8 | 116.4 | 117 | 29 | 21 | 37 |
| 2010 | 1 | 118.7 | 118.7 | 118.7 | 37 | 37 | 37 | 37 | |
| Sum | 52 | 111.6 | 8.47 | 92.5 | 133.9 | 4234 | 81 | 20 | 1310 |
| Interbul test evaluation 192r |
| Population : SVN - BSW |