| No. of Bulls (birth year >= 1999) by country |
| Sent data format 300 - Trait : mil |
| Country | Year of birth | Sum | |||||||||||||||
|---|---|---|---|---|---|---|---|---|---|---|---|---|---|---|---|---|---|
| 1999 | 2000 | 2001 | 2002 | 2003 | 2004 | 2005 | 2006 | 2007 | 2008 | 2009 | 2010 | 2011 | 2012 | 2013 | |||
| AUT | AUSTRIA | 1 | 1 | 4 | 3 | 1 | 2 | 1 | 2 | 3 | 3 | 2 | 23 | ||||
| CZE | CZECH REPUBLIC | 1 | 1 | 2 | |||||||||||||
| DEU | GERMANY | 6 | 8 | 9 | 12 | 8 | 8 | 8 | 12 | 5 | 6 | 7 | 7 | 3 | 4 | 2 | 105 |
| ITA | ITALY | 1 | 1 | 2 | |||||||||||||
| SVK | SLOVAKIA | 1 | 1 | ||||||||||||||
| SVN | SLOVENIA | 21 | 21 | 18 | 17 | 21 | 23 | 16 | 23 | 19 | 16 | 18 | 21 | 19 | 19 | 11 | 283 |
| Sum | 28 | 29 | 28 | 34 | 33 | 34 | 27 | 36 | 24 | 24 | 28 | 31 | 24 | 23 | 13 | 416 | |
| Interbul test evaluation 182r |
| Population : SVN - SIM |
| No. of Bulls (birth year >= 1999) by origin |
| Sent data format 300 - Trait : mil |
| Origin | Year of birth | Sum | ||||||||||||||
|---|---|---|---|---|---|---|---|---|---|---|---|---|---|---|---|---|
| 1999 | 2000 | 2001 | 2002 | 2003 | 2004 | 2005 | 2006 | 2007 | 2008 | 2009 | 2010 | 2011 | 2012 | 2013 | ||
| SVN | 21 | 21 | 18 | 17 | 21 | 23 | 16 | 23 | 19 | 16 | 18 | 21 | 19 | 19 | 11 | 283 |
| Foreign | 7 | 8 | 10 | 17 | 12 | 11 | 11 | 13 | 5 | 8 | 10 | 10 | 5 | 4 | 2 | 133 |
| Sum | 28 | 29 | 28 | 34 | 33 | 34 | 27 | 36 | 24 | 24 | 28 | 31 | 24 | 23 | 13 | 416 |
| Interbul test evaluation 182r |
| Population : SVN - SIM |
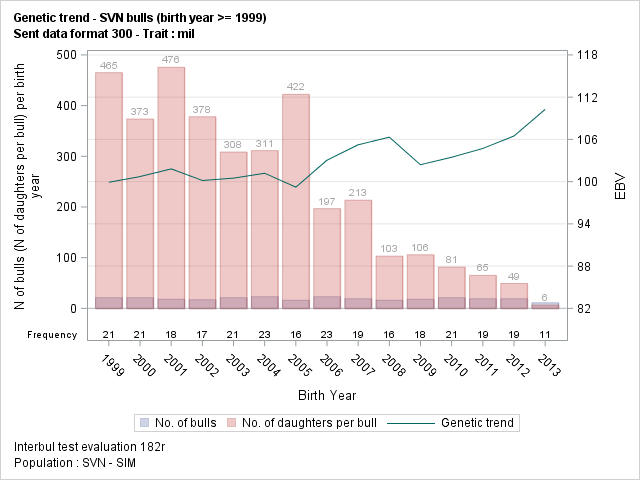
| Genetic trend - SVN bulls (birth year >= 1999) |
| Sent data format 300 - Trait : mil |
| Year | EBV | N Daughter | |||||||
|---|---|---|---|---|---|---|---|---|---|
| n Bull | Mean | Std | Min | Max | Sum | Mean | Min | Max | |
| 1999 | 21 | 99.9 | 4.88 | 91.3 | 108.5 | 9764 | 465 | 127 | 919 |
| 2000 | 21 | 100.7 | 4.95 | 93.5 | 113.7 | 7843 | 373 | 1 | 1117 |
| 2001 | 18 | 101.8 | 7.49 | 90.8 | 119.0 | 8560 | 476 | 73 | 1864 |
| 2002 | 17 | 100.2 | 4.40 | 91.8 | 108.7 | 6426 | 378 | 1 | 1352 |
| 2003 | 21 | 100.5 | 7.44 | 88.1 | 114.4 | 6477 | 308 | 29 | 1070 |
| 2004 | 23 | 101.2 | 5.13 | 91.6 | 117.6 | 7156 | 311 | 1 | 1126 |
| 2005 | 16 | 99.2 | 2.93 | 94.2 | 105.1 | 6755 | 422 | 92 | 1419 |
| 2006 | 23 | 103.0 | 4.69 | 95.3 | 113.1 | 4524 | 197 | 1 | 1428 |
| 2007 | 19 | 105.2 | 4.60 | 98.5 | 113.4 | 4055 | 213 | 23 | 661 |
| 2008 | 16 | 106.3 | 5.57 | 99.4 | 119.8 | 1649 | 103 | 4 | 293 |
| 2009 | 18 | 102.4 | 3.22 | 94.3 | 107.5 | 1903 | 106 | 11 | 179 |
| 2010 | 21 | 103.5 | 6.42 | 93.9 | 120.0 | 1709 | 81 | 3 | 192 |
| 2011 | 19 | 104.7 | 4.77 | 98.6 | 112.8 | 1236 | 65 | 3 | 111 |
| 2012 | 19 | 106.5 | 6.19 | 96.1 | 121.2 | 931 | 49 | 11 | 80 |
| 2013 | 11 | 110.3 | 7.15 | 101.7 | 128.4 | 71 | 6 | 2 | 16 |
| Sum | 283 | 102.8 | 5.96 | 88.1 | 128.4 | 69059 | 244 | 1 | 1864 |
| Interbul test evaluation 182r |
| Population : SVN - SIM |
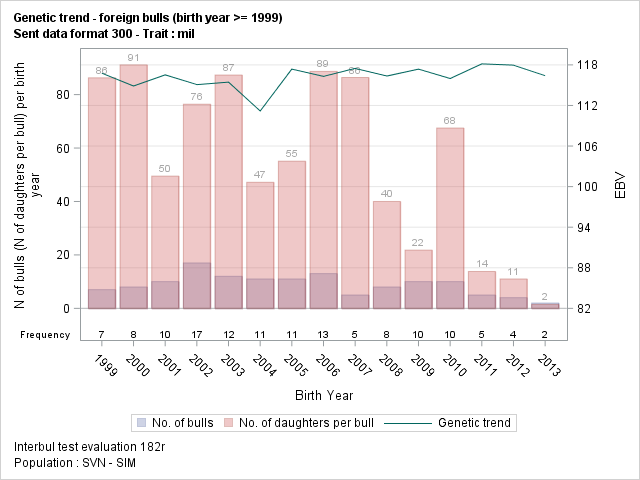
| Genetic trend - foreign bulls (birth year >= 1999) |
| Sent data format 300 - Trait : mil |
| Year | EBV | N Daughter | |||||||
|---|---|---|---|---|---|---|---|---|---|
| n Bull | Mean | Std | Min | Max | Sum | Mean | Min | Max | |
| 1999 | 7 | 116.8 | 10.31 | 101.2 | 130.1 | 604 | 86 | 9 | 200 |
| 2000 | 8 | 114.9 | 4.34 | 108.2 | 120.6 | 729 | 91 | 1 | 454 |
| 2001 | 10 | 116.5 | 3.23 | 111.3 | 120.6 | 495 | 50 | 2 | 118 |
| 2002 | 17 | 115.1 | 6.87 | 104.0 | 127.3 | 1299 | 76 | 18 | 321 |
| 2003 | 12 | 115.4 | 7.02 | 100.0 | 127.8 | 1048 | 87 | 3 | 199 |
| 2004 | 11 | 111.2 | 9.93 | 85.8 | 120.0 | 519 | 47 | 5 | 97 |
| 2005 | 11 | 117.4 | 4.81 | 110.8 | 123.7 | 606 | 55 | 20 | 94 |
| 2006 | 13 | 116.3 | 10.40 | 93.4 | 131.2 | 1153 | 89 | 3 | 298 |
| 2007 | 5 | 117.5 | 8.08 | 107.3 | 127.7 | 432 | 86 | 5 | 197 |
| 2008 | 8 | 116.4 | 8.37 | 104.2 | 130.7 | 320 | 40 | 2 | 120 |
| 2009 | 10 | 117.4 | 6.63 | 107.6 | 128.7 | 218 | 22 | 1 | 95 |
| 2010 | 10 | 116.0 | 9.63 | 99.7 | 131.4 | 675 | 68 | 1 | 427 |
| 2011 | 5 | 118.1 | 10.36 | 104.5 | 132.9 | 69 | 14 | 1 | 53 |
| 2012 | 4 | 118.0 | 7.14 | 110.7 | 124.4 | 44 | 11 | 2 | 21 |
| 2013 | 2 | 116.4 | 6.93 | 111.5 | 121.3 | 3 | 2 | 1 | 2 |
| Sum | 133 | 115.9 | 7.62 | 85.8 | 132.9 | 8214 | 62 | 1 | 454 |
| Interbul test evaluation 182r |
| Population : SVN - SIM |
| No. of Bulls (meet validation's criteria) by country |
| Sent data format 300 - Trait : mil |
| Validation's criteria : |
| - N daughter min. : 20 |
| - N herd min. : 10 |
| - Year birth min. : 1999 |
| Country | Year of birth | Sum | ||||||||||||||
|---|---|---|---|---|---|---|---|---|---|---|---|---|---|---|---|---|
| 1999 | 2000 | 2001 | 2002 | 2003 | 2004 | 2005 | 2006 | 2007 | 2008 | 2009 | 2010 | 2011 | 2012 | |||
| AUT | AUSTRIA | 1 | 1 | 4 | 3 | 1 | 2 | 2 | 2 | 2 | 18 | |||||
| CZE | CZECH REPUBLIC | 1 | 1 | 2 | ||||||||||||
| DEU | GERMANY | 5 | 6 | 6 | 11 | 6 | 7 | 8 | 10 | 3 | 4 | 1 | 3 | 1 | 1 | 72 |
| ITA | ITALY | 1 | 1 | 2 | ||||||||||||
| SVK | SLOVAKIA | 1 | 1 | |||||||||||||
| SVN | SLOVENIA | 21 | 20 | 18 | 16 | 20 | 21 | 16 | 22 | 19 | 15 | 17 | 20 | 18 | 17 | 260 |
| Sum | 27 | 26 | 25 | 32 | 30 | 31 | 27 | 32 | 22 | 21 | 20 | 25 | 19 | 18 | 355 | |
| Interbul test evaluation 182r |
| Population : SVN - SIM |
| No. of Bulls (meet validation's criteria) by origin |
| Sent data format 300 - Trait : mil |
| Origin | Year of birth | Sum | |||||||||||||
|---|---|---|---|---|---|---|---|---|---|---|---|---|---|---|---|
| 1999 | 2000 | 2001 | 2002 | 2003 | 2004 | 2005 | 2006 | 2007 | 2008 | 2009 | 2010 | 2011 | 2012 | ||
| SVN | 21 | 20 | 18 | 16 | 20 | 21 | 16 | 22 | 19 | 15 | 17 | 20 | 18 | 17 | 260 |
| Foreign | 6 | 6 | 7 | 16 | 10 | 10 | 11 | 10 | 3 | 6 | 3 | 5 | 1 | 1 | 95 |
| Sum | 27 | 26 | 25 | 32 | 30 | 31 | 27 | 32 | 22 | 21 | 20 | 25 | 19 | 18 | 355 |
| Interbul test evaluation 182r |
| Population : SVN - SIM |
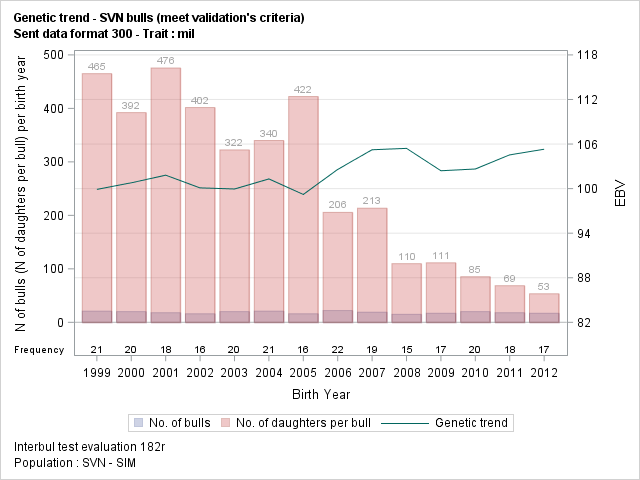
| Genetic trend - SVN bulls (meet validation's criteria) |
| Sent data format 300 - Trait : mil |
| Year | EBV | N Daughter | |||||||
|---|---|---|---|---|---|---|---|---|---|
| n Bull | Mean | Std | Min | Max | Sum | Mean | Min | Max | |
| 1999 | 21 | 99.9 | 4.88 | 91.3 | 108.5 | 9764 | 465 | 127 | 919 |
| 2000 | 20 | 100.8 | 5.07 | 93.5 | 113.7 | 7842 | 392 | 46 | 1117 |
| 2001 | 18 | 101.8 | 7.49 | 90.8 | 119.0 | 8560 | 476 | 73 | 1864 |
| 2002 | 16 | 100.1 | 4.54 | 91.8 | 108.7 | 6425 | 402 | 125 | 1352 |
| 2003 | 20 | 99.9 | 7.18 | 88.1 | 114.4 | 6448 | 322 | 103 | 1070 |
| 2004 | 21 | 101.3 | 4.67 | 93.7 | 117.6 | 7139 | 340 | 107 | 1126 |
| 2005 | 16 | 99.2 | 2.93 | 94.2 | 105.1 | 6755 | 422 | 92 | 1419 |
| 2006 | 22 | 102.6 | 4.23 | 95.3 | 110.5 | 4523 | 206 | 74 | 1428 |
| 2007 | 19 | 105.2 | 4.60 | 98.5 | 113.4 | 4055 | 213 | 23 | 661 |
| 2008 | 15 | 105.4 | 4.41 | 99.4 | 114.1 | 1645 | 110 | 22 | 293 |
| 2009 | 17 | 102.4 | 3.32 | 94.3 | 107.5 | 1892 | 111 | 56 | 179 |
| 2010 | 20 | 102.6 | 5.31 | 93.9 | 115.5 | 1706 | 85 | 35 | 192 |
| 2011 | 18 | 104.5 | 4.85 | 98.6 | 112.8 | 1233 | 69 | 29 | 111 |
| 2012 | 17 | 105.3 | 5.14 | 96.1 | 117.7 | 908 | 53 | 22 | 80 |
| Sum | 260 | 102.2 | 5.35 | 88.1 | 119.0 | 68895 | 265 | 22 | 1864 |
| Interbul test evaluation 182r |
| Population : SVN - SIM |
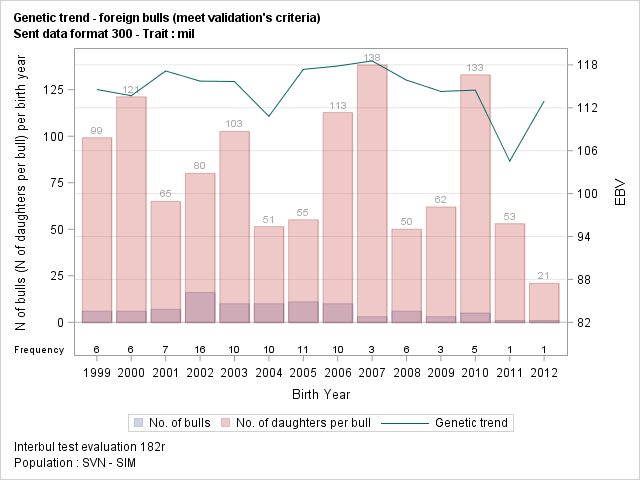
| Genetic trend - foreign bulls (meet validation's criteria) |
| Sent data format 300 - Trait : mil |
| Year | EBV | N Daughter | |||||||
|---|---|---|---|---|---|---|---|---|---|
| n Bull | Mean | Std | Min | Max | Sum | Mean | Min | Max | |
| 1999 | 6 | 114.6 | 9.29 | 101.2 | 124.5 | 595 | 99 | 34 | 200 |
| 2000 | 6 | 113.7 | 4.21 | 108.2 | 118.8 | 727 | 121 | 29 | 454 |
| 2001 | 7 | 117.2 | 3.37 | 111.3 | 120.6 | 455 | 65 | 21 | 118 |
| 2002 | 16 | 115.7 | 6.55 | 104.0 | 127.3 | 1281 | 80 | 33 | 321 |
| 2003 | 10 | 115.7 | 7.55 | 100.0 | 127.8 | 1026 | 103 | 28 | 199 |
| 2004 | 10 | 110.8 | 10.38 | 85.8 | 120.0 | 514 | 51 | 22 | 97 |
| 2005 | 11 | 117.4 | 4.81 | 110.8 | 123.7 | 606 | 55 | 20 | 94 |
| 2006 | 10 | 117.8 | 8.94 | 105.7 | 131.2 | 1127 | 113 | 30 | 298 |
| 2007 | 3 | 118.6 | 10.34 | 107.3 | 127.7 | 415 | 138 | 58 | 197 |
| 2008 | 6 | 115.9 | 9.60 | 104.2 | 130.7 | 300 | 50 | 20 | 120 |
| 2009 | 3 | 114.3 | 2.31 | 111.6 | 115.6 | 186 | 62 | 20 | 95 |
| 2010 | 5 | 114.5 | 11.33 | 99.7 | 130.5 | 665 | 133 | 23 | 427 |
| 2011 | 1 | 104.5 | 104.5 | 104.5 | 53 | 53 | 53 | 53 | |
| 2012 | 1 | 112.9 | 112.9 | 112.9 | 21 | 21 | 21 | 21 | |
| Sum | 95 | 115.4 | 7.57 | 85.8 | 131.2 | 7971 | 84 | 20 | 454 |
| Interbul test evaluation 182r |
| Population : SVN - SIM |