| No. of Bulls (birth year >= 1999) by country |
| Sent data format 300 - Trait : mil |
| Country | Year of birth | Sum | ||||||||||||||
|---|---|---|---|---|---|---|---|---|---|---|---|---|---|---|---|---|
| 1999 | 2000 | 2001 | 2002 | 2003 | 2004 | 2005 | 2006 | 2007 | 2008 | 2009 | 2010 | 2011 | 2012 | |||
| BEL | BELGIUM | 1 | 1 | |||||||||||||
| CAN | CANADA | 4 | 1 | 2 | 1 | 2 | 4 | 3 | 17 | |||||||
| CHE | SWITZERLAND | 1 | 1 | |||||||||||||
| DEU | GERMANY | 2 | 5 | 5 | 4 | 11 | 9 | 3 | 9 | 1 | 2 | 2 | 5 | 4 | 3 | 65 |
| DNK | DENMARK | 1 | 1 | 1 | 1 | 1 | 1 | 1 | 2 | 1 | 10 | |||||
| FRA | FRANCE | 1 | 1 | 1 | 2 | 1 | 6 | |||||||||
| GBR | GREAT BRITAIN | 1 | 1 | 2 | ||||||||||||
| ITA | ITALY | 5 | 2 | 4 | 1 | 1 | 1 | 2 | 2 | 18 | ||||||
| NLD | NETHERLAND | 2 | 6 | 3 | 3 | 2 | 3 | 4 | 2 | 2 | 2 | 1 | 1 | 31 | ||
| SVN | SLOVENIA | 7 | 5 | 11 | 6 | 10 | 6 | 11 | 6 | 15 | 9 | 11 | 14 | 15 | 13 | 139 |
| USA | USA | 2 | 2 | 9 | 9 | 5 | 7 | 7 | 6 | 5 | 5 | 5 | 3 | 1 | 1 | 67 |
| Sum | 24 | 22 | 33 | 27 | 30 | 29 | 28 | 32 | 29 | 20 | 19 | 25 | 21 | 18 | 357 | |
| Interbul test evaluation 172r |
| Population : SVN - HOL |
| No. of Bulls (birth year >= 1999) by origin |
| Sent data format 300 - Trait : mil |
| Origin | Year of birth | Sum | |||||||||||||
|---|---|---|---|---|---|---|---|---|---|---|---|---|---|---|---|
| 1999 | 2000 | 2001 | 2002 | 2003 | 2004 | 2005 | 2006 | 2007 | 2008 | 2009 | 2010 | 2011 | 2012 | ||
| SVN | 7 | 5 | 11 | 6 | 10 | 6 | 11 | 6 | 15 | 9 | 11 | 14 | 15 | 13 | 139 |
| Foreign | 17 | 17 | 22 | 21 | 20 | 23 | 17 | 26 | 14 | 11 | 8 | 11 | 6 | 5 | 218 |
| Sum | 24 | 22 | 33 | 27 | 30 | 29 | 28 | 32 | 29 | 20 | 19 | 25 | 21 | 18 | 357 |
| Interbul test evaluation 172r |
| Population : SVN - HOL |
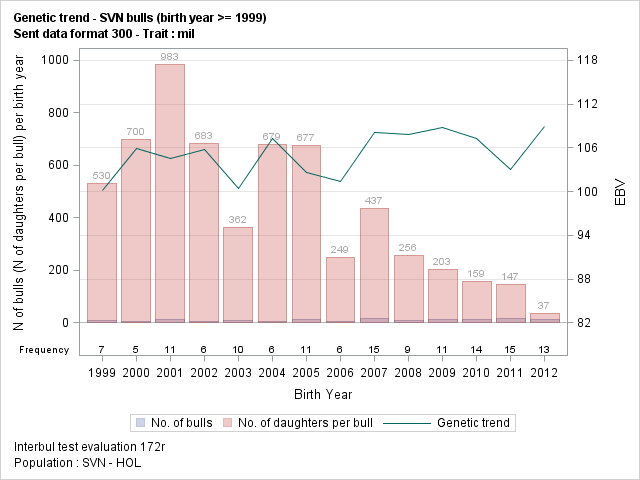
| Genetic trend - SVN bulls (birth year >= 1999) |
| Sent data format 300 - Trait : mil |
| Year | EBV | N Daughter | |||||||
|---|---|---|---|---|---|---|---|---|---|
| n Bull | Mean | Std | Min | Max | Sum | Mean | Min | Max | |
| 1999 | 7 | 100.2 | 4.71 | 92.9 | 108.0 | 3713 | 530 | 18 | 984 |
| 2000 | 5 | 106.0 | 4.41 | 100.3 | 110.7 | 3499 | 700 | 313 | 1043 |
| 2001 | 11 | 104.5 | 12.09 | 90.3 | 131.0 | 10818 | 983 | 555 | 1579 |
| 2002 | 6 | 105.8 | 7.12 | 93.2 | 112.8 | 4095 | 683 | 358 | 1390 |
| 2003 | 10 | 100.4 | 8.08 | 87.6 | 111.6 | 3624 | 362 | 21 | 1123 |
| 2004 | 6 | 107.3 | 8.42 | 97.7 | 121.9 | 4075 | 679 | 79 | 1743 |
| 2005 | 11 | 102.7 | 5.86 | 90.8 | 109.1 | 7447 | 677 | 228 | 1884 |
| 2006 | 6 | 101.4 | 6.40 | 95.5 | 110.0 | 1491 | 249 | 86 | 500 |
| 2007 | 15 | 108.1 | 9.55 | 87.4 | 124.6 | 6555 | 437 | 175 | 1288 |
| 2008 | 9 | 107.8 | 9.68 | 92.7 | 127.1 | 2306 | 256 | 117 | 339 |
| 2009 | 11 | 108.8 | 6.86 | 98.8 | 120.5 | 2228 | 203 | 159 | 251 |
| 2010 | 14 | 107.3 | 11.45 | 94.8 | 141.6 | 2231 | 159 | 1 | 327 |
| 2011 | 15 | 103.1 | 4.89 | 94.2 | 109.3 | 2203 | 147 | 75 | 197 |
| 2012 | 13 | 109.0 | 8.69 | 87.4 | 122.3 | 479 | 37 | 1 | 152 |
| Sum | 139 | 105.4 | 8.55 | 87.4 | 141.6 | 54764 | 394 | 1 | 1884 |
| Interbul test evaluation 172r |
| Population : SVN - HOL |
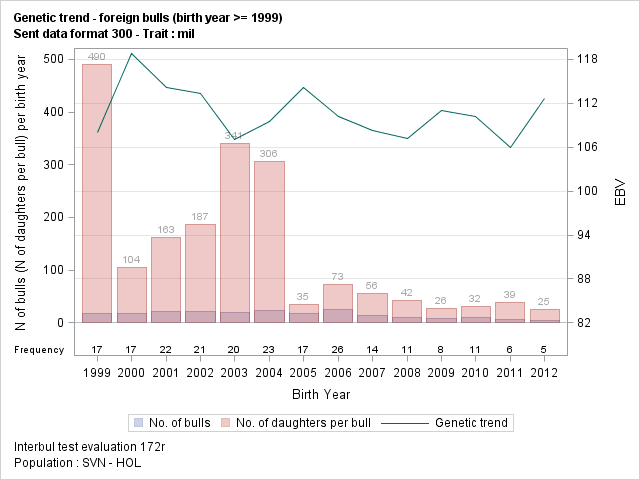
| Genetic trend - foreign bulls (birth year >= 1999) |
| Sent data format 300 - Trait : mil |
| Year | EBV | N Daughter | |||||||
|---|---|---|---|---|---|---|---|---|---|
| n Bull | Mean | Std | Min | Max | Sum | Mean | Min | Max | |
| 1999 | 17 | 108.1 | 7.92 | 94.4 | 126.1 | 8338 | 490 | 1 | 1881 |
| 2000 | 17 | 118.9 | 9.49 | 103.3 | 139.7 | 1775 | 104 | 8 | 435 |
| 2001 | 22 | 114.2 | 10.11 | 96.7 | 136.8 | 3575 | 163 | 7 | 1520 |
| 2002 | 21 | 113.3 | 12.14 | 76.8 | 130.8 | 3930 | 187 | 14 | 1768 |
| 2003 | 20 | 107.1 | 12.62 | 82.7 | 131.5 | 6817 | 341 | 33 | 1676 |
| 2004 | 23 | 109.6 | 10.31 | 90.7 | 134.0 | 7031 | 306 | 4 | 3071 |
| 2005 | 17 | 114.2 | 10.89 | 97.3 | 132.5 | 590 | 35 | 6 | 80 |
| 2006 | 26 | 110.2 | 9.64 | 93.0 | 132.7 | 1901 | 73 | 21 | 272 |
| 2007 | 14 | 108.3 | 7.22 | 96.4 | 122.9 | 724 | 56 | 5 | 109 |
| 2008 | 11 | 107.2 | 11.93 | 94.1 | 132.9 | 460 | 42 | 3 | 76 |
| 2009 | 8 | 111.0 | 10.84 | 100.6 | 132.6 | 211 | 26 | 2 | 54 |
| 2010 | 11 | 110.2 | 10.35 | 89.1 | 121.2 | 348 | 32 | 7 | 97 |
| 2011 | 6 | 106.0 | 11.34 | 89.7 | 120.2 | 232 | 39 | 4 | 126 |
| 2012 | 5 | 112.6 | 7.67 | 102.3 | 122.3 | 125 | 25 | 1 | 84 |
| Sum | 218 | 111.1 | 10.63 | 76.8 | 139.7 | 36057 | 166 | 1 | 3071 |
| Interbul test evaluation 172r |
| Population : SVN - HOL |
| No. of Bulls (meet validation's criteria) by country |
| Sent data format 300 - Trait : mil |
| Validation's criteria : |
| - N daughter min. : 20 |
| - N herd min. : 10 |
| - Year birth min. : 1999 |
| Country | Year of birth | Sum | ||||||||||||||
|---|---|---|---|---|---|---|---|---|---|---|---|---|---|---|---|---|
| 1999 | 2000 | 2001 | 2002 | 2003 | 2004 | 2005 | 2006 | 2007 | 2008 | 2009 | 2010 | 2011 | 2012 | |||
| BEL | BELGIUM | 1 | 1 | |||||||||||||
| CAN | CANADA | 4 | 1 | 1 | 2 | 4 | 2 | 14 | ||||||||
| CHE | SWITZERLAND | 1 | 1 | |||||||||||||
| DEU | GERMANY | 2 | 5 | 5 | 4 | 11 | 8 | 1 | 9 | 1 | 2 | 3 | 2 | 1 | 54 | |
| DNK | DENMARK | 1 | 1 | 1 | 1 | 1 | 1 | 6 | ||||||||
| FRA | FRANCE | 1 | 1 | 1 | 2 | 1 | 6 | |||||||||
| GBR | GREAT BRITAIN | 1 | 1 | |||||||||||||
| ITA | ITALY | 5 | 2 | 4 | 1 | 1 | 2 | 1 | 16 | |||||||
| NLD | NETHERLAND | 2 | 5 | 2 | 3 | 2 | 3 | 2 | 2 | 2 | 1 | 1 | 1 | 26 | ||
| SVN | SLOVENIA | 6 | 5 | 11 | 6 | 9 | 6 | 11 | 6 | 15 | 9 | 11 | 13 | 15 | 7 | 130 |
| USA | USA | 2 | 2 | 8 | 8 | 5 | 7 | 6 | 6 | 5 | 4 | 2 | 3 | 58 | ||
| Sum | 22 | 20 | 31 | 25 | 29 | 27 | 22 | 32 | 27 | 18 | 14 | 20 | 18 | 8 | 313 | |
| Interbul test evaluation 172r |
| Population : SVN - HOL |
| No. of Bulls (meet validation's criteria) by origin |
| Sent data format 300 - Trait : mil |
| Origin | Year of birth | Sum | |||||||||||||
|---|---|---|---|---|---|---|---|---|---|---|---|---|---|---|---|
| 1999 | 2000 | 2001 | 2002 | 2003 | 2004 | 2005 | 2006 | 2007 | 2008 | 2009 | 2010 | 2011 | 2012 | ||
| SVN | 6 | 5 | 11 | 6 | 9 | 6 | 11 | 6 | 15 | 9 | 11 | 13 | 15 | 7 | 130 |
| Foreign | 16 | 15 | 20 | 19 | 20 | 21 | 11 | 26 | 12 | 9 | 3 | 7 | 3 | 1 | 183 |
| Sum | 22 | 20 | 31 | 25 | 29 | 27 | 22 | 32 | 27 | 18 | 14 | 20 | 18 | 8 | 313 |
| Interbul test evaluation 172r |
| Population : SVN - HOL |
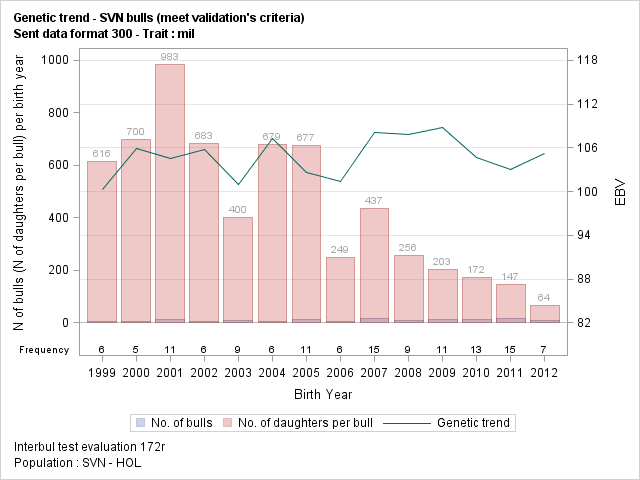
| Genetic trend - SVN bulls (meet validation's criteria) |
| Sent data format 300 - Trait : mil |
| Year | EBV | N Daughter | |||||||
|---|---|---|---|---|---|---|---|---|---|
| n Bull | Mean | Std | Min | Max | Sum | Mean | Min | Max | |
| 1999 | 6 | 100.4 | 5.13 | 92.9 | 108.0 | 3695 | 616 | 272 | 984 |
| 2000 | 5 | 106.0 | 4.41 | 100.3 | 110.7 | 3499 | 700 | 313 | 1043 |
| 2001 | 11 | 104.5 | 12.09 | 90.3 | 131.0 | 10818 | 983 | 555 | 1579 |
| 2002 | 6 | 105.8 | 7.12 | 93.2 | 112.8 | 4095 | 683 | 358 | 1390 |
| 2003 | 9 | 101.0 | 8.34 | 87.6 | 111.6 | 3603 | 400 | 28 | 1123 |
| 2004 | 6 | 107.3 | 8.42 | 97.7 | 121.9 | 4075 | 679 | 79 | 1743 |
| 2005 | 11 | 102.7 | 5.86 | 90.8 | 109.1 | 7447 | 677 | 228 | 1884 |
| 2006 | 6 | 101.4 | 6.40 | 95.5 | 110.0 | 1491 | 249 | 86 | 500 |
| 2007 | 15 | 108.1 | 9.55 | 87.4 | 124.6 | 6555 | 437 | 175 | 1288 |
| 2008 | 9 | 107.8 | 9.68 | 92.7 | 127.1 | 2306 | 256 | 117 | 339 |
| 2009 | 11 | 108.8 | 6.86 | 98.8 | 120.5 | 2228 | 203 | 159 | 251 |
| 2010 | 13 | 104.7 | 6.08 | 94.8 | 113.2 | 2230 | 172 | 101 | 327 |
| 2011 | 15 | 103.1 | 4.89 | 94.2 | 109.3 | 2203 | 147 | 75 | 197 |
| 2012 | 7 | 105.3 | 9.06 | 87.4 | 115.3 | 449 | 64 | 23 | 152 |
| Sum | 130 | 104.9 | 7.89 | 87.4 | 131.0 | 54694 | 421 | 23 | 1884 |
| Interbul test evaluation 172r |
| Population : SVN - HOL |
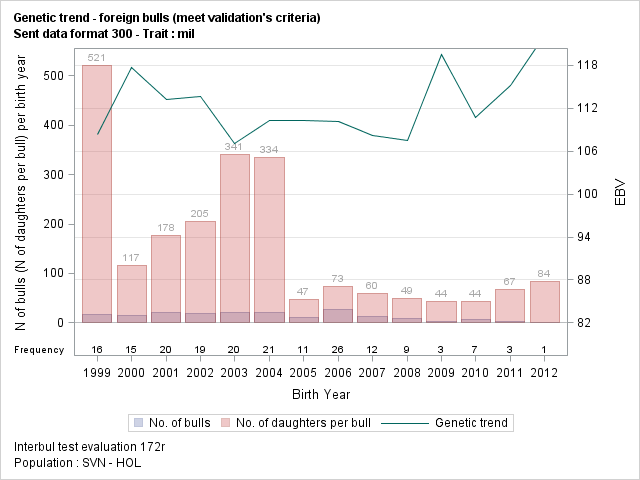
| Genetic trend - foreign bulls (meet validation's criteria) |
| Sent data format 300 - Trait : mil |
| Year | EBV | N Daughter | |||||||
|---|---|---|---|---|---|---|---|---|---|
| n Bull | Mean | Std | Min | Max | Sum | Mean | Min | Max | |
| 1999 | 16 | 108.4 | 8.06 | 94.4 | 126.1 | 8337 | 521 | 41 | 1881 |
| 2000 | 15 | 117.7 | 9.26 | 103.3 | 139.7 | 1750 | 117 | 21 | 435 |
| 2001 | 20 | 113.3 | 10.17 | 96.7 | 136.8 | 3554 | 178 | 29 | 1520 |
| 2002 | 19 | 113.6 | 12.75 | 76.8 | 130.8 | 3898 | 205 | 31 | 1768 |
| 2003 | 20 | 107.1 | 12.62 | 82.7 | 131.5 | 6817 | 341 | 33 | 1676 |
| 2004 | 21 | 110.3 | 9.99 | 90.7 | 134.0 | 7007 | 334 | 31 | 3071 |
| 2005 | 11 | 110.3 | 9.57 | 97.3 | 127.8 | 515 | 47 | 26 | 80 |
| 2006 | 26 | 110.2 | 9.64 | 93.0 | 132.7 | 1901 | 73 | 21 | 272 |
| 2007 | 12 | 108.2 | 7.72 | 96.4 | 122.9 | 719 | 60 | 29 | 109 |
| 2008 | 9 | 107.5 | 12.69 | 94.1 | 132.9 | 441 | 49 | 20 | 76 |
| 2009 | 3 | 119.5 | 12.38 | 108.0 | 132.6 | 132 | 44 | 28 | 54 |
| 2010 | 7 | 110.7 | 8.01 | 99.9 | 120.9 | 306 | 44 | 21 | 97 |
| 2011 | 3 | 115.2 | 4.46 | 111.8 | 120.2 | 201 | 67 | 34 | 126 |
| 2012 | 1 | 122.3 | 122.3 | 122.3 | 84 | 84 | 84 | 84 | |
| Sum | 183 | 111.1 | 10.48 | 76.8 | 139.7 | 35662 | 195 | 20 | 3071 |
| Interbul test evaluation 172r |
| Population : SVN - HOL |