| No. of Bulls (birth year >= 1999) by country |
| Sent data format 300 - Trait : mil |
| Country | Year of birth | Sum | ||||||||||||||
|---|---|---|---|---|---|---|---|---|---|---|---|---|---|---|---|---|
| 1999 | 2000 | 2001 | 2002 | 2003 | 2004 | 2005 | 2006 | 2007 | 2008 | 2009 | 2010 | 2011 | 2012 | |||
| AUT | AUSTRIA | 1 | 1 | 1 | 1 | 2 | 6 | |||||||||
| CHE | SWITZERLAND | 1 | 1 | 1 | 6 | 2 | 3 | 5 | 1 | 1 | 21 | |||||
| DEU | GERMANY | 2 | 3 | 4 | 4 | 6 | 1 | 6 | 2 | 3 | 2 | 2 | 2 | 37 | ||
| ITA | ITALY | 5 | 1 | 4 | 1 | 1 | 3 | 2 | 17 | |||||||
| SVN | SLOVENIA | 12 | 12 | 10 | 11 | 14 | 10 | 15 | 8 | 10 | 10 | 13 | 13 | 8 | 3 | 149 |
| USA | USA | 1 | 1 | 1 | 1 | 1 | 1 | 6 | ||||||||
| Sum | 20 | 18 | 21 | 19 | 27 | 15 | 29 | 13 | 18 | 14 | 15 | 16 | 8 | 3 | 236 | |
| Interbul test evaluation 172r |
| Population : SVN - BSW |
| No. of Bulls (birth year >= 1999) by origin |
| Sent data format 300 - Trait : mil |
| Origin | Year of birth | Sum | |||||||||||||
|---|---|---|---|---|---|---|---|---|---|---|---|---|---|---|---|
| 1999 | 2000 | 2001 | 2002 | 2003 | 2004 | 2005 | 2006 | 2007 | 2008 | 2009 | 2010 | 2011 | 2012 | ||
| SVN | 12 | 12 | 10 | 11 | 14 | 10 | 15 | 8 | 10 | 10 | 13 | 13 | 8 | 3 | 149 |
| Foreign | 8 | 6 | 11 | 8 | 13 | 5 | 14 | 5 | 8 | 4 | 2 | 3 | 87 | ||
| Sum | 20 | 18 | 21 | 19 | 27 | 15 | 29 | 13 | 18 | 14 | 15 | 16 | 8 | 3 | 236 |
| Interbul test evaluation 172r |
| Population : SVN - BSW |
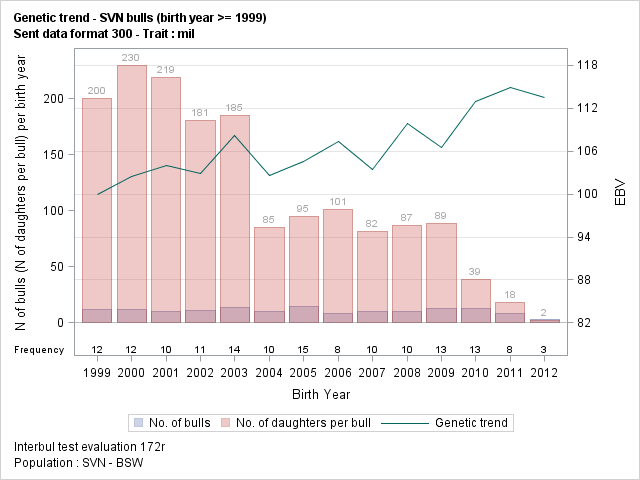
| Genetic trend - SVN bulls (birth year >= 1999) |
| Sent data format 300 - Trait : mil |
| Year | EBV | N Daughter | |||||||
|---|---|---|---|---|---|---|---|---|---|
| n Bull | Mean | Std | Min | Max | Sum | Mean | Min | Max | |
| 1999 | 12 | 99.9 | 8.72 | 74.3 | 107.6 | 2405 | 200 | 83 | 449 |
| 2000 | 12 | 102.4 | 5.97 | 88.1 | 109.6 | 2760 | 230 | 8 | 741 |
| 2001 | 10 | 104.0 | 4.56 | 94.2 | 112.5 | 2194 | 219 | 83 | 676 |
| 2002 | 11 | 102.9 | 3.81 | 95.4 | 109.5 | 1992 | 181 | 51 | 728 |
| 2003 | 14 | 108.2 | 7.87 | 97.7 | 125.2 | 2590 | 185 | 1 | 697 |
| 2004 | 10 | 102.6 | 8.95 | 89.9 | 116.3 | 849 | 85 | 21 | 165 |
| 2005 | 15 | 104.5 | 8.42 | 82.8 | 112.9 | 1426 | 95 | 18 | 299 |
| 2006 | 8 | 107.4 | 6.57 | 95.0 | 113.0 | 810 | 101 | 65 | 167 |
| 2007 | 10 | 103.4 | 10.98 | 75.5 | 115.2 | 816 | 82 | 56 | 92 |
| 2008 | 10 | 109.9 | 5.36 | 99.8 | 118.8 | 869 | 87 | 24 | 146 |
| 2009 | 13 | 106.5 | 6.40 | 90.3 | 115.9 | 1154 | 89 | 57 | 125 |
| 2010 | 13 | 112.9 | 9.18 | 95.1 | 125.3 | 504 | 39 | 1 | 62 |
| 2011 | 8 | 114.9 | 7.30 | 103.4 | 126.3 | 143 | 18 | 1 | 40 |
| 2012 | 3 | 113.5 | 22.07 | 88.2 | 128.6 | 7 | 2 | 1 | 5 |
| Sum | 149 | 106.1 | 8.70 | 74.3 | 128.6 | 18519 | 124 | 1 | 741 |
| Interbul test evaluation 172r |
| Population : SVN - BSW |
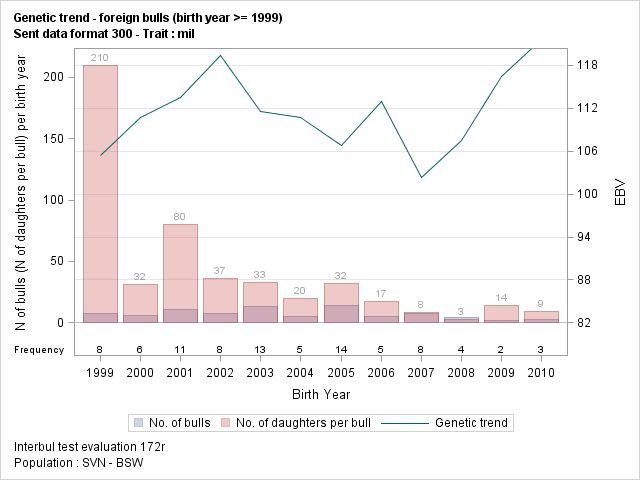
| Genetic trend - foreign bulls (birth year >= 1999) |
| Sent data format 300 - Trait : mil |
| Year | EBV | N Daughter | |||||||
|---|---|---|---|---|---|---|---|---|---|
| n Bull | Mean | Std | Min | Max | Sum | Mean | Min | Max | |
| 1999 | 8 | 105.4 | 8.23 | 92.8 | 119.5 | 1678 | 210 | 5 | 1305 |
| 2000 | 6 | 110.8 | 3.92 | 103.3 | 114.5 | 189 | 32 | 3 | 74 |
| 2001 | 11 | 113.6 | 5.03 | 105.9 | 122.0 | 880 | 80 | 6 | 582 |
| 2002 | 8 | 119.4 | 12.12 | 102.7 | 136.1 | 292 | 37 | 5 | 78 |
| 2003 | 13 | 111.6 | 8.28 | 96.3 | 127.0 | 427 | 33 | 4 | 77 |
| 2004 | 5 | 110.7 | 10.76 | 95.8 | 125.7 | 100 | 20 | 5 | 32 |
| 2005 | 14 | 106.8 | 6.84 | 95.1 | 119.3 | 454 | 32 | 5 | 175 |
| 2006 | 5 | 112.9 | 8.30 | 103.4 | 124.9 | 87 | 17 | 3 | 26 |
| 2007 | 8 | 102.4 | 13.95 | 74.2 | 111.8 | 67 | 8 | 1 | 20 |
| 2008 | 4 | 107.5 | 4.13 | 102.4 | 112.0 | 11 | 3 | 1 | 4 |
| 2009 | 2 | 116.4 | 17.76 | 103.8 | 128.9 | 28 | 14 | 13 | 15 |
| 2010 | 3 | 121.8 | 9.13 | 114.2 | 131.9 | 27 | 9 | 1 | 25 |
| Sum | 87 | 110.6 | 9.70 | 74.2 | 136.1 | 4240 | 49 | 1 | 1305 |
| Interbul test evaluation 172r |
| Population : SVN - BSW |
| No. of Bulls (meet validation's criteria) by country |
| Sent data format 300 - Trait : mil |
| Validation's criteria : |
| - N daughter min. : 20 |
| - N herd min. : 10 |
| - Year birth min. : 1999 |
| Country | Year of birth | Sum | |||||||||||||
|---|---|---|---|---|---|---|---|---|---|---|---|---|---|---|---|
| 1999 | 2000 | 2001 | 2002 | 2003 | 2004 | 2005 | 2006 | 2007 | 2008 | 2009 | 2010 | 2011 | |||
| AUT | AUSTRIA | 1 | 1 | 1 | 1 | 2 | 6 | ||||||||
| CHE | SWITZERLAND | 1 | 1 | 1 | 3 | 1 | 1 | 1 | 9 | ||||||
| DEU | GERMANY | 1 | 2 | 2 | 4 | 5 | 1 | 1 | 16 | ||||||
| ITA | ITALY | 5 | 3 | 1 | 2 | 11 | |||||||||
| SVN | SLOVENIA | 12 | 11 | 10 | 11 | 13 | 10 | 14 | 8 | 10 | 10 | 13 | 10 | 4 | 136 |
| USA | USA | 1 | 1 | 1 | 1 | 4 | |||||||||
| Sum | 18 | 15 | 18 | 18 | 22 | 13 | 18 | 11 | 11 | 10 | 13 | 11 | 4 | 182 | |
| Interbul test evaluation 172r |
| Population : SVN - BSW |
| No. of Bulls (meet validation's criteria) by origin |
| Sent data format 300 - Trait : mil |
| Origin | Year of birth | Sum | ||||||||||||
|---|---|---|---|---|---|---|---|---|---|---|---|---|---|---|
| 1999 | 2000 | 2001 | 2002 | 2003 | 2004 | 2005 | 2006 | 2007 | 2008 | 2009 | 2010 | 2011 | ||
| SVN | 12 | 11 | 10 | 11 | 13 | 10 | 14 | 8 | 10 | 10 | 13 | 10 | 4 | 136 |
| Foreign | 6 | 4 | 8 | 7 | 9 | 3 | 4 | 3 | 1 | 1 | 46 | |||
| Sum | 18 | 15 | 18 | 18 | 22 | 13 | 18 | 11 | 11 | 10 | 13 | 11 | 4 | 182 |
| Interbul test evaluation 172r |
| Population : SVN - BSW |
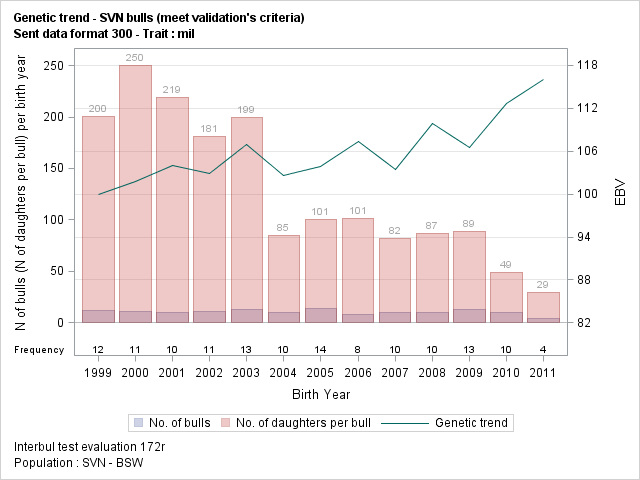
| Genetic trend - SVN bulls (meet validation's criteria) |
| Sent data format 300 - Trait : mil |
| Year | EBV | N Daughter | |||||||
|---|---|---|---|---|---|---|---|---|---|
| n Bull | Mean | Std | Min | Max | Sum | Mean | Min | Max | |
| 1999 | 12 | 99.9 | 8.72 | 74.3 | 107.6 | 2405 | 200 | 83 | 449 |
| 2000 | 11 | 101.8 | 5.85 | 88.1 | 109.6 | 2752 | 250 | 96 | 741 |
| 2001 | 10 | 104.0 | 4.56 | 94.2 | 112.5 | 2194 | 219 | 83 | 676 |
| 2002 | 11 | 102.9 | 3.81 | 95.4 | 109.5 | 1992 | 181 | 51 | 728 |
| 2003 | 13 | 106.9 | 6.42 | 97.7 | 116.8 | 2589 | 199 | 57 | 697 |
| 2004 | 10 | 102.6 | 8.95 | 89.9 | 116.3 | 849 | 85 | 21 | 165 |
| 2005 | 14 | 103.9 | 8.40 | 82.8 | 111.2 | 1408 | 101 | 24 | 299 |
| 2006 | 8 | 107.4 | 6.57 | 95.0 | 113.0 | 810 | 101 | 65 | 167 |
| 2007 | 10 | 103.4 | 10.98 | 75.5 | 115.2 | 816 | 82 | 56 | 92 |
| 2008 | 10 | 109.9 | 5.36 | 99.8 | 118.8 | 869 | 87 | 24 | 146 |
| 2009 | 13 | 106.5 | 6.40 | 90.3 | 115.9 | 1154 | 89 | 57 | 125 |
| 2010 | 10 | 112.6 | 8.36 | 95.1 | 125.3 | 492 | 49 | 33 | 62 |
| 2011 | 4 | 116.0 | 4.01 | 111.7 | 121.0 | 117 | 29 | 24 | 40 |
| Sum | 136 | 105.3 | 7.91 | 74.3 | 125.3 | 18447 | 136 | 21 | 741 |
| Interbul test evaluation 172r |
| Population : SVN - BSW |
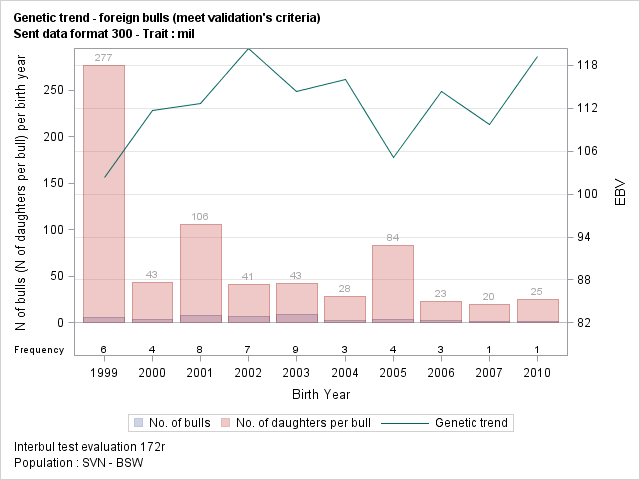
| Genetic trend - foreign bulls (meet validation's criteria) |
| Sent data format 300 - Trait : mil |
| Year | EBV | N Daughter | |||||||
|---|---|---|---|---|---|---|---|---|---|
| n Bull | Mean | Std | Min | Max | Sum | Mean | Min | Max | |
| 1999 | 6 | 102.3 | 6.23 | 92.8 | 110.5 | 1661 | 277 | 36 | 1305 |
| 2000 | 4 | 111.7 | 1.13 | 110.4 | 112.8 | 173 | 43 | 27 | 74 |
| 2001 | 8 | 112.7 | 4.12 | 105.9 | 119.4 | 850 | 106 | 21 | 582 |
| 2002 | 7 | 120.4 | 12.76 | 102.7 | 136.1 | 287 | 41 | 23 | 78 |
| 2003 | 9 | 114.4 | 7.10 | 103.9 | 127.0 | 384 | 43 | 27 | 77 |
| 2004 | 3 | 116.1 | 8.72 | 108.6 | 125.7 | 84 | 28 | 26 | 32 |
| 2005 | 4 | 105.1 | 7.00 | 95.1 | 110.5 | 334 | 84 | 28 | 175 |
| 2006 | 3 | 114.4 | 10.74 | 103.4 | 124.9 | 69 | 23 | 21 | 26 |
| 2007 | 1 | 109.7 | 109.7 | 109.7 | 20 | 20 | 20 | 20 | |
| 2010 | 1 | 119.2 | 119.2 | 119.2 | 25 | 25 | 25 | 25 | |
| Sum | 46 | 112.5 | 8.99 | 92.8 | 136.1 | 3887 | 85 | 20 | 1305 |
| Interbul test evaluation 172r |
| Population : SVN - BSW |