| Correlations EBV_2012 : EBV_2016 |
| Sent data format 303 - Trait : mil |
| Statistic | Variable | EBV_2012 | EBV_2016 |
|---|---|---|---|
| MEAN | 109.1429 | 109.1414 | |
| STD | 10.69209 | 10.41721 | |
| N | 153 | 153 | |
| CORR | pv12 | 1 | 0.822779 |
| CORR | pv12_end | 0.822779 | 1 |
| Interbul test evaluation 171t |
| Population : SVN - HOL |
| No. of Bulls by country for evaluation yyyy-4 (2012) |
| Sent data format 303 - Trait : mil |
| Country | Year of birth | Sum | ||||||||||
|---|---|---|---|---|---|---|---|---|---|---|---|---|
| 1999 | 2000 | 2001 | 2002 | 2003 | 2004 | 2005 | 2006 | 2007 | 2008 | |||
| CAN | CANADA | 1 | 1 | 1 | 3 | |||||||
| DEU | GERMANY | 2 | 5 | 3 | 3 | 8 | 4 | 25 | ||||
| DNK | DENMARK | 1 | 1 | 2 | ||||||||
| FRA | FRANCE | 1 | 1 | 2 | ||||||||
| GBR | GREAT BRITAIN | 1 | 1 | |||||||||
| ITA | ITALY | 5 | 2 | 2 | 1 | 10 | ||||||
| NLD | NETHERLAND | 1 | 5 | 2 | 3 | 2 | 3 | 16 | ||||
| SVN | SLOVENIA | 3 | 4 | 11 | 5 | 6 | 5 | 11 | 6 | 15 | 6 | 72 |
| USA | USA | 1 | 1 | 9 | 6 | 4 | 1 | 22 | ||||
| Sum | 14 | 18 | 28 | 21 | 21 | 13 | 11 | 6 | 15 | 6 | 153 | |
| Interbul test evaluation 171t |
| Population : SVN - HOL |
| No. of Bulls by origin for evaluation yyyy-4 (2012) |
| Sent data format 303 - Trait : mil |
| Origin | Year of birth | Sum | |||||||||
|---|---|---|---|---|---|---|---|---|---|---|---|
| 1999 | 2000 | 2001 | 2002 | 2003 | 2004 | 2005 | 2006 | 2007 | 2008 | ||
| SVN | 3 | 4 | 11 | 5 | 6 | 5 | 11 | 6 | 15 | 6 | 72 |
| Foreign | 11 | 14 | 17 | 16 | 15 | 8 | 81 | ||||
| Sum | 14 | 18 | 28 | 21 | 21 | 13 | 11 | 6 | 15 | 6 | 153 |
| Interbul test evaluation 171t |
| Population : SVN - HOL |
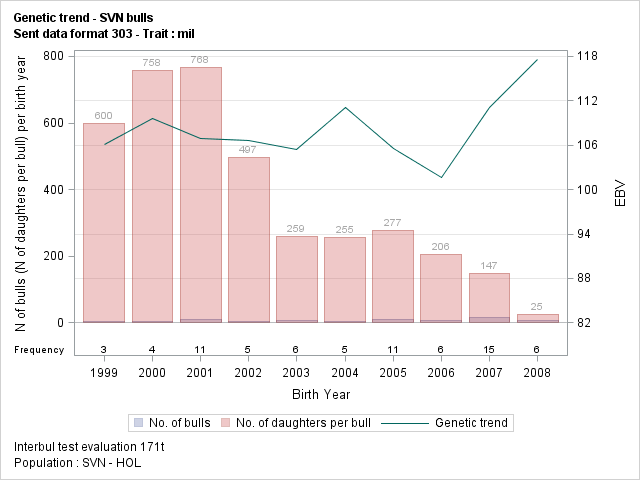
| Genetic trend - SVN bulls |
| Sent data format 303 - Trait : mil |
| Year | EBV | N Daughter | |||||||
|---|---|---|---|---|---|---|---|---|---|
| n Bull | Mean | Std | Min | Max | Sum | Mean | Min | Max | |
| 1999 | 3 | 106.1 | 4.15 | 102.6 | 110.7 | 1799 | 600 | 468 | 702 |
| 2000 | 4 | 109.6 | 3.28 | 105.8 | 113.6 | 3033 | 758 | 553 | 1025 |
| 2001 | 11 | 106.9 | 12.59 | 92.0 | 134.4 | 8447 | 768 | 472 | 1249 |
| 2002 | 5 | 106.6 | 7.21 | 94.7 | 112.6 | 2485 | 497 | 390 | 695 |
| 2003 | 6 | 105.4 | 8.10 | 93.5 | 113.7 | 1556 | 259 | 185 | 324 |
| 2004 | 5 | 111.0 | 10.93 | 97.9 | 127.5 | 1276 | 255 | 138 | 383 |
| 2005 | 11 | 105.6 | 7.26 | 94.1 | 114.8 | 3048 | 277 | 158 | 491 |
| 2006 | 6 | 101.7 | 5.95 | 95.1 | 111.3 | 1233 | 206 | 83 | 413 |
| 2007 | 15 | 111.1 | 10.69 | 88.4 | 124.9 | 2209 | 147 | 36 | 273 |
| 2008 | 6 | 117.5 | 12.60 | 98.5 | 130.0 | 147 | 25 | 1 | 89 |
| Sum | 72 | 108.3 | 9.85 | 88.4 | 134.4 | 25233 | 350 | 1 | 1249 |
| Interbul test evaluation 171t |
| Population : SVN - HOL |
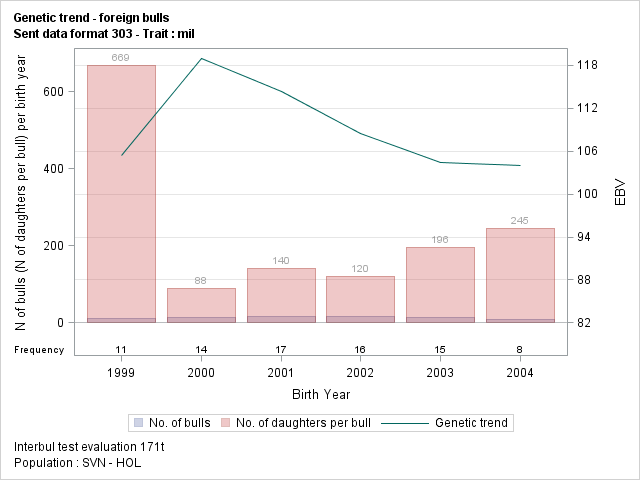
| Genetic trend - foreign bulls |
| Sent data format 303 - Trait : mil |
| Year | EBV | N Daughter | |||||||
|---|---|---|---|---|---|---|---|---|---|
| n Bull | Mean | Std | Min | Max | Sum | Mean | Min | Max | |
| 1999 | 11 | 105.4 | 5.38 | 92.8 | 112.2 | 7356 | 669 | 4 | 1874 |
| 2000 | 14 | 119.0 | 11.52 | 105.9 | 143.2 | 1232 | 88 | 14 | 308 |
| 2001 | 17 | 114.3 | 10.58 | 97.0 | 139.2 | 2386 | 140 | 6 | 1013 |
| 2002 | 16 | 108.4 | 11.04 | 86.9 | 135.1 | 1918 | 120 | 1 | 1404 |
| 2003 | 15 | 104.4 | 12.02 | 84.3 | 129.2 | 2935 | 196 | 1 | 818 |
| 2004 | 8 | 104.0 | 6.06 | 96.0 | 115.7 | 1958 | 245 | 1 | 898 |
| Sum | 81 | 109.9 | 11.40 | 84.3 | 143.2 | 17785 | 220 | 1 | 1874 |
| Interbul test evaluation 171t |
| Population : SVN - HOL |
| Correlations EBV_2012 : EBV_2016 (meet validation's criteria) |
| Sent data format 303 - Trait : mil |
| Validation's criteria : |
| - N daughter min. : 20 |
| - N herd min. : 10 |
| - Year birth min. : 1999 |
| - N daughter(yyyy-4) <> N daughter |
| Statistic | Variable | EBV_2012 | EBV_2016 |
|---|---|---|---|
| MEAN | 109.3228 | 108.8754 | |
| STD | 10.41505 | 10.57553 | |
| N | 128 | 128 | |
| CORR | pv12 | 1 | 0.865289 |
| CORR | pv12_end | 0.865289 | 1 |
| Interbul test evaluation 171t |
| Population : SVN - HOL |
| No. of Bulls (meet validation's criteria) by country for evaluation yyyy-4 (2012) |
| Sent data format 303 - Trait : mil |
| Country | Year of birth | Sum | ||||||||||
|---|---|---|---|---|---|---|---|---|---|---|---|---|
| 1999 | 2000 | 2001 | 2002 | 2003 | 2004 | 2005 | 2006 | 2007 | 2008 | |||
| CAN | CANADA | 1 | 1 | 2 | ||||||||
| DEU | GERMANY | 1 | 4 | 3 | 3 | 6 | 3 | 20 | ||||
| FRA | FRANCE | 1 | 1 | 2 | ||||||||
| ITA | ITALY | 5 | 2 | 2 | 1 | 10 | ||||||
| NLD | NETHERLAND | 4 | 2 | 2 | 1 | 1 | 10 | |||||
| SVN | SLOVENIA | 3 | 4 | 11 | 5 | 6 | 5 | 11 | 6 | 15 | 2 | 68 |
| USA | USA | 1 | 1 | 8 | 4 | 2 | 16 | |||||
| Sum | 11 | 16 | 27 | 16 | 15 | 9 | 11 | 6 | 15 | 2 | 128 | |
| Interbul test evaluation 171t |
| Population : SVN - HOL |
| No. of Bulls (meet validation's criteria) by origin for evaluation yyyy-4 (2012) |
| Sent data format 303 - Trait : mil |
| Origin | Year of birth | Sum | |||||||||
|---|---|---|---|---|---|---|---|---|---|---|---|
| 1999 | 2000 | 2001 | 2002 | 2003 | 2004 | 2005 | 2006 | 2007 | 2008 | ||
| SVN | 3 | 4 | 11 | 5 | 6 | 5 | 11 | 6 | 15 | 2 | 68 |
| Foreign | 8 | 12 | 16 | 11 | 9 | 4 | 60 | ||||
| Sum | 11 | 16 | 27 | 16 | 15 | 9 | 11 | 6 | 15 | 2 | 128 |
| Interbul test evaluation 171t |
| Population : SVN - HOL |
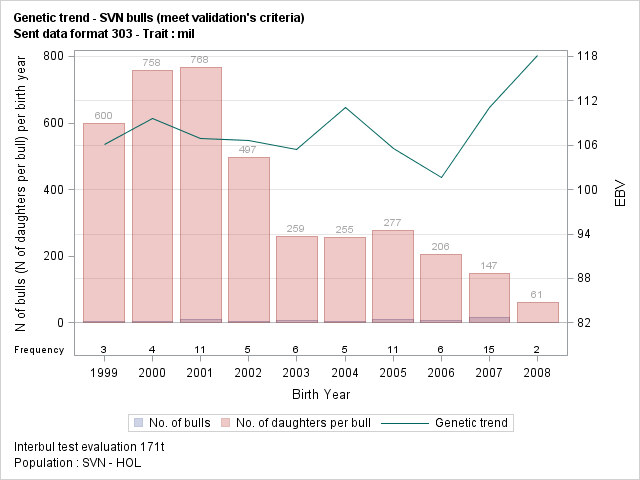
| Genetic trend - SVN bulls (meet validation's criteria) |
| Sent data format 303 - Trait : mil |
| Year | EBV | N Daughter | |||||||
|---|---|---|---|---|---|---|---|---|---|
| n Bull | Mean | Std | Min | Max | Sum | Mean | Min | Max | |
| 1999 | 3 | 106.1 | 4.15 | 102.6 | 110.7 | 1799 | 600 | 468 | 702 |
| 2000 | 4 | 109.6 | 3.28 | 105.8 | 113.6 | 3033 | 758 | 553 | 1025 |
| 2001 | 11 | 106.9 | 12.59 | 92.0 | 134.4 | 8447 | 768 | 472 | 1249 |
| 2002 | 5 | 106.6 | 7.21 | 94.7 | 112.6 | 2485 | 497 | 390 | 695 |
| 2003 | 6 | 105.4 | 8.10 | 93.5 | 113.7 | 1556 | 259 | 185 | 324 |
| 2004 | 5 | 111.0 | 10.93 | 97.9 | 127.5 | 1276 | 255 | 138 | 383 |
| 2005 | 11 | 105.6 | 7.26 | 94.1 | 114.8 | 3048 | 277 | 158 | 491 |
| 2006 | 6 | 101.7 | 5.95 | 95.1 | 111.3 | 1233 | 206 | 83 | 413 |
| 2007 | 15 | 111.1 | 10.69 | 88.4 | 124.9 | 2209 | 147 | 36 | 273 |
| 2008 | 2 | 118.1 | 11.95 | 109.6 | 126.5 | 122 | 61 | 33 | 89 |
| Sum | 68 | 107.8 | 9.38 | 88.4 | 134.4 | 25208 | 371 | 33 | 1249 |
| Interbul test evaluation 171t |
| Population : SVN - HOL |
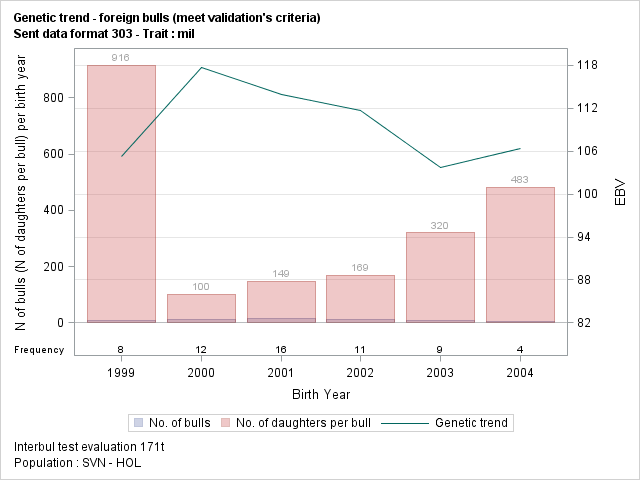
| Genetic trend - foreign bulls (meet validation's criteria) |
| Sent data format 303 - Trait : mil |
| Year | EBV | N Daughter | |||||||
|---|---|---|---|---|---|---|---|---|---|
| n Bull | Mean | Std | Min | Max | Sum | Mean | Min | Max | |
| 1999 | 8 | 105.3 | 5.88 | 92.8 | 112.2 | 7327 | 916 | 39 | 1874 |
| 2000 | 12 | 117.7 | 10.89 | 105.9 | 143.2 | 1202 | 100 | 22 | 308 |
| 2001 | 16 | 114.0 | 10.82 | 97.0 | 139.2 | 2380 | 149 | 23 | 1013 |
| 2002 | 11 | 111.6 | 10.58 | 98.9 | 135.1 | 1861 | 169 | 21 | 1404 |
| 2003 | 9 | 103.8 | 13.58 | 84.3 | 129.2 | 2876 | 320 | 23 | 818 |
| 2004 | 4 | 106.3 | 6.42 | 101.3 | 115.7 | 1930 | 483 | 37 | 898 |
| Sum | 60 | 111.1 | 11.29 | 84.3 | 143.2 | 17576 | 293 | 21 | 1874 |
| Interbul test evaluation 171t |
| Population : SVN - HOL |