| Correlations EBV_2010 : EBV_2014 |
| Sent data format 303 - Trait : mil |
| Statistic | Variable | EBV_2010 | EBV_2014 |
|---|---|---|---|
| MEAN | 106.9586 | 104.714 | |
| STD | 7.947381 | 6.889771 | |
| N | 164 | 164 | |
| CORR | pv12 | 1 | 0.849889 |
| CORR | pv12_end | 0.849889 | 1 |
| Interbul test evaluation 142t |
| Population : SVN - SIM |
| No. of Bulls by country for evaluation yyyy-4 (2010) |
| Sent data format 303 - Trait : mil |
| Country | Year of birth | Sum | ||||||||
|---|---|---|---|---|---|---|---|---|---|---|
| 1999 | 2000 | 2001 | 2002 | 2003 | 2004 | 2005 | 2006 | |||
| AUT | AUSTRIA | 1 | 1 | 1 | 1 | 4 | ||||
| CZE | CZECH REPUBLIC | 1 | 1 | 2 | ||||||
| DEU | GERMANY | 5 | 5 | 4 | 1 | 1 | 1 | 17 | ||
| ITA | ITALY | 1 | 1 | 2 | ||||||
| SVK | SLOVAKIA | 1 | 1 | |||||||
| SVN | SLOVENIA | 18 | 18 | 17 | 13 | 21 | 21 | 16 | 14 | 138 |
| Sum | 24 | 23 | 21 | 16 | 23 | 24 | 19 | 14 | 164 | |
| Interbul test evaluation 142t |
| Population : SVN - SIM |
| No. of Bulls by origin for evaluation yyyy-4 (2010) |
| Sent data format 303 - Trait : mil |
| Origin | Year of birth | Sum | |||||||
|---|---|---|---|---|---|---|---|---|---|
| 1999 | 2000 | 2001 | 2002 | 2003 | 2004 | 2005 | 2006 | ||
| SVN | 18 | 18 | 17 | 13 | 21 | 21 | 16 | 14 | 138 |
| Foreign | 6 | 5 | 4 | 3 | 2 | 3 | 3 | 26 | |
| Sum | 24 | 23 | 21 | 16 | 23 | 24 | 19 | 14 | 164 |
| Interbul test evaluation 142t |
| Population : SVN - SIM |
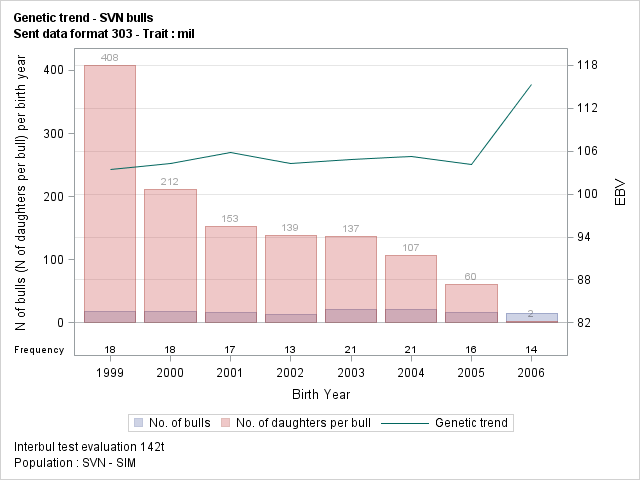
| Genetic trend - SVN bulls |
| Sent data format 303 - Trait : mil |
| Year | EBV | N Daughter | |||||||
|---|---|---|---|---|---|---|---|---|---|
| n Bull | Mean | Std | Min | Max | Sum | Mean | Min | Max | |
| 1999 | 18 | 103.5 | 5.50 | 92.6 | 113.4 | 7345 | 408 | 130 | 770 |
| 2000 | 18 | 104.2 | 5.82 | 96.5 | 118.3 | 3818 | 212 | 37 | 800 |
| 2001 | 17 | 105.8 | 7.54 | 93.7 | 126.4 | 2602 | 153 | 71 | 394 |
| 2002 | 13 | 104.3 | 4.42 | 98.5 | 112.8 | 1805 | 139 | 111 | 172 |
| 2003 | 21 | 104.8 | 6.74 | 92.6 | 116.9 | 2879 | 137 | 24 | 242 |
| 2004 | 21 | 105.3 | 3.90 | 99.7 | 117.7 | 2247 | 107 | 14 | 180 |
| 2005 | 16 | 104.1 | 3.17 | 99.4 | 109.6 | 964 | 60 | 33 | 93 |
| 2006 | 14 | 115.3 | 6.70 | 103.7 | 127.4 | 28 | 2 | 1 | 5 |
| Sum | 138 | 105.7 | 6.45 | 92.6 | 127.4 | 21688 | 157 | 1 | 800 |
| Interbul test evaluation 142t |
| Population : SVN - SIM |
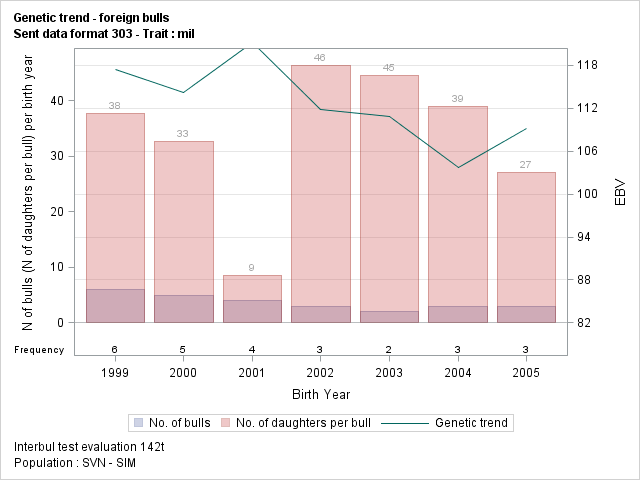
| Genetic trend - foreign bulls |
| Sent data format 303 - Trait : mil |
| Year | EBV | N Daughter | |||||||
|---|---|---|---|---|---|---|---|---|---|
| n Bull | Mean | Std | Min | Max | Sum | Mean | Min | Max | |
| 1999 | 6 | 117.4 | 14.26 | 94.1 | 135.2 | 226 | 38 | 2 | 111 |
| 2000 | 5 | 114.1 | 5.65 | 110.4 | 124.1 | 163 | 33 | 17 | 57 |
| 2001 | 4 | 121.4 | 11.05 | 108.1 | 133.2 | 34 | 9 | 1 | 15 |
| 2002 | 3 | 111.8 | 6.45 | 105.4 | 118.3 | 139 | 46 | 39 | 51 |
| 2003 | 2 | 110.8 | 11.43 | 102.8 | 118.9 | 89 | 45 | 34 | 55 |
| 2004 | 3 | 103.7 | 19.13 | 81.6 | 115.9 | 117 | 39 | 22 | 60 |
| 2005 | 3 | 109.2 | 2.93 | 106.6 | 112.4 | 81 | 27 | 21 | 32 |
| Sum | 26 | 113.7 | 11.29 | 81.6 | 135.2 | 849 | 33 | 1 | 111 |
| Interbul test evaluation 142t |
| Population : SVN - SIM |
| Correlations EBV_2010 : EBV_2014 (meet validation's criteria) |
| Sent data format 303 - Trait : mil |
| Validation's criteria : |
| - N daughter min. : 20 |
| - N herd min. : 10 |
| - Year birth min. : 1999 |
| - N daughter(yyyy-4) <> N daughter |
| Statistic | Variable | EBV_2010 | EBV_2014 |
|---|---|---|---|
| MEAN | 105.4841 | 103.969 | |
| STD | 6.597084 | 6.732707 | |
| N | 140 | 140 | |
| CORR | pv12 | 1 | 0.938483 |
| CORR | pv12_end | 0.938483 | 1 |
| Interbul test evaluation 142t |
| Population : SVN - SIM |
| No. of Bulls (meet validation's criteria) by country for evaluation yyyy-4 (2010) |
| Sent data format 303 - Trait : mil |
| Country | Year of birth | Sum | |||||||
|---|---|---|---|---|---|---|---|---|---|
| 1999 | 2000 | 2001 | 2002 | 2003 | 2004 | 2005 | |||
| AUT | AUSTRIA | 1 | 1 | 1 | 3 | ||||
| CZE | CZECH REPUBLIC | 1 | 1 | 2 | |||||
| DEU | GERMANY | 3 | 4 | 1 | 1 | 1 | 10 | ||
| ITA | ITALY | 1 | 1 | 2 | |||||
| SVK | SLOVAKIA | 1 | 1 | ||||||
| SVN | SLOVENIA | 18 | 18 | 17 | 13 | 20 | 20 | 16 | 122 |
| Sum | 21 | 22 | 17 | 16 | 22 | 23 | 19 | 140 | |
| Interbul test evaluation 142t |
| Population : SVN - SIM |
| No. of Bulls (meet validation's criteria) by origin for evaluation yyyy-4 (2010) |
| Sent data format 303 - Trait : mil |
| Origin | Year of birth | Sum | ||||||
|---|---|---|---|---|---|---|---|---|
| 1999 | 2000 | 2001 | 2002 | 2003 | 2004 | 2005 | ||
| SVN | 18 | 18 | 17 | 13 | 20 | 20 | 16 | 122 |
| Foreign | 3 | 4 | 3 | 2 | 3 | 3 | 18 | |
| Sum | 21 | 22 | 17 | 16 | 22 | 23 | 19 | 140 |
| Interbul test evaluation 142t |
| Population : SVN - SIM |
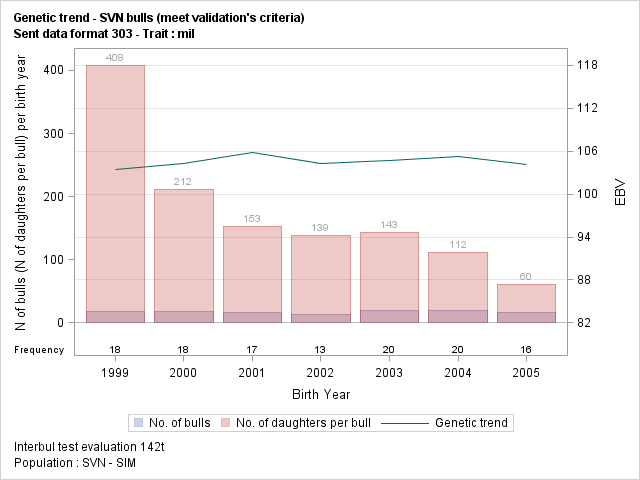
| Genetic trend - SVN bulls (meet validation's criteria) |
| Sent data format 303 - Trait : mil |
| Year | EBV | N Daughter | |||||||
|---|---|---|---|---|---|---|---|---|---|
| n Bull | Mean | Std | Min | Max | Sum | Mean | Min | Max | |
| 1999 | 18 | 103.5 | 5.50 | 92.6 | 113.4 | 7345 | 408 | 130 | 770 |
| 2000 | 18 | 104.2 | 5.82 | 96.5 | 118.3 | 3818 | 212 | 37 | 800 |
| 2001 | 17 | 105.8 | 7.54 | 93.7 | 126.4 | 2602 | 153 | 71 | 394 |
| 2002 | 13 | 104.3 | 4.42 | 98.5 | 112.8 | 1805 | 139 | 111 | 172 |
| 2003 | 20 | 104.8 | 6.91 | 92.6 | 116.9 | 2855 | 143 | 97 | 242 |
| 2004 | 20 | 105.2 | 3.99 | 99.7 | 117.7 | 2233 | 112 | 59 | 180 |
| 2005 | 16 | 104.1 | 3.17 | 99.4 | 109.6 | 964 | 60 | 33 | 93 |
| Sum | 122 | 104.6 | 5.50 | 92.6 | 126.4 | 21622 | 177 | 33 | 800 |
| Interbul test evaluation 142t |
| Population : SVN - SIM |
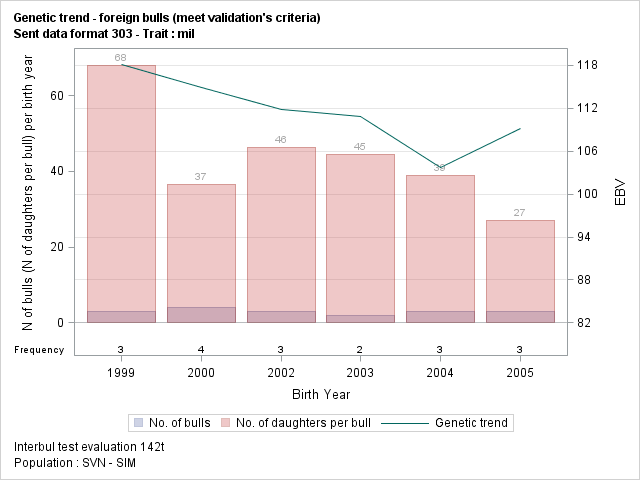
| Genetic trend - foreign bulls (meet validation's criteria) |
| Sent data format 303 - Trait : mil |
| Year | EBV | N Daughter | |||||||
|---|---|---|---|---|---|---|---|---|---|
| n Bull | Mean | Std | Min | Max | Sum | Mean | Min | Max | |
| 1999 | 3 | 118.1 | 8.49 | 108.3 | 123.2 | 204 | 68 | 45 | 111 |
| 2000 | 4 | 115.0 | 6.16 | 110.4 | 124.1 | 146 | 37 | 21 | 57 |
| 2002 | 3 | 111.8 | 6.45 | 105.4 | 118.3 | 139 | 46 | 39 | 51 |
| 2003 | 2 | 110.8 | 11.43 | 102.8 | 118.9 | 89 | 45 | 34 | 55 |
| 2004 | 3 | 103.7 | 19.13 | 81.6 | 115.9 | 117 | 39 | 22 | 60 |
| 2005 | 3 | 109.2 | 2.93 | 106.6 | 112.4 | 81 | 27 | 21 | 32 |
| Sum | 18 | 111.7 | 9.71 | 81.6 | 124.1 | 776 | 43 | 21 | 111 |
| Interbul test evaluation 142t |
| Population : SVN - SIM |